Download presentation
Presentation is loading. Please wait.

2
Why? What? How? What is poverty? Findings Major conclusions How did we get here What’s next

3
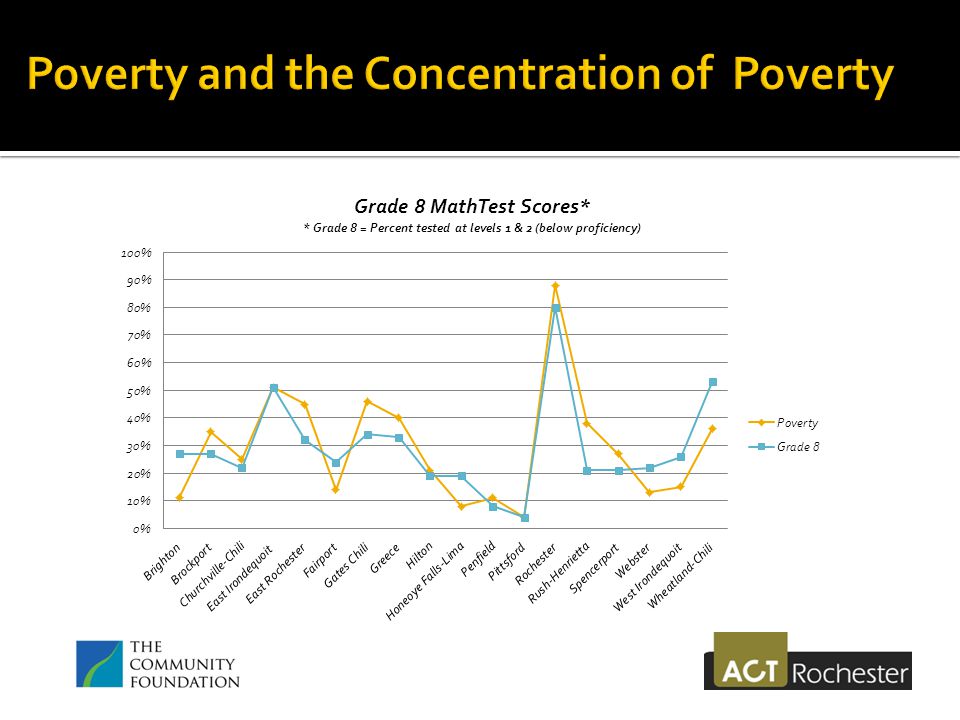
A Framework People and Data Poverty and the Concentration of Poverty Assets and Deficits

4
Why? What? How? Why: To enhance community awareness and understanding of poverty, particularly the concentration of poverty. What: Analysis of poverty in the nine-county Greater Rochester Area with special emphasis on the concentration of the poor within the City of Rochester. How: Staff research of U.S. Census data, ACT Rochester data and studies by other reputable organizations; national comparisons and benchmark comparisons for comparably sized communities.

5
What is Poverty? Can you picture it?

6
What is Poverty? Definition: The Federal Poverty Level The price of food in 1963, multiplied by 3, and adjusted since 1963 based on the increase in the CPI.

7
Poverty and Self-Sufficiency Family SizePoverty Level Self-Sufficiency Standard 1$11,490 $20,042 2 15,510 38,773 3 19,530 47,391 4 23,550 58,284 5 27,570 58,598

8
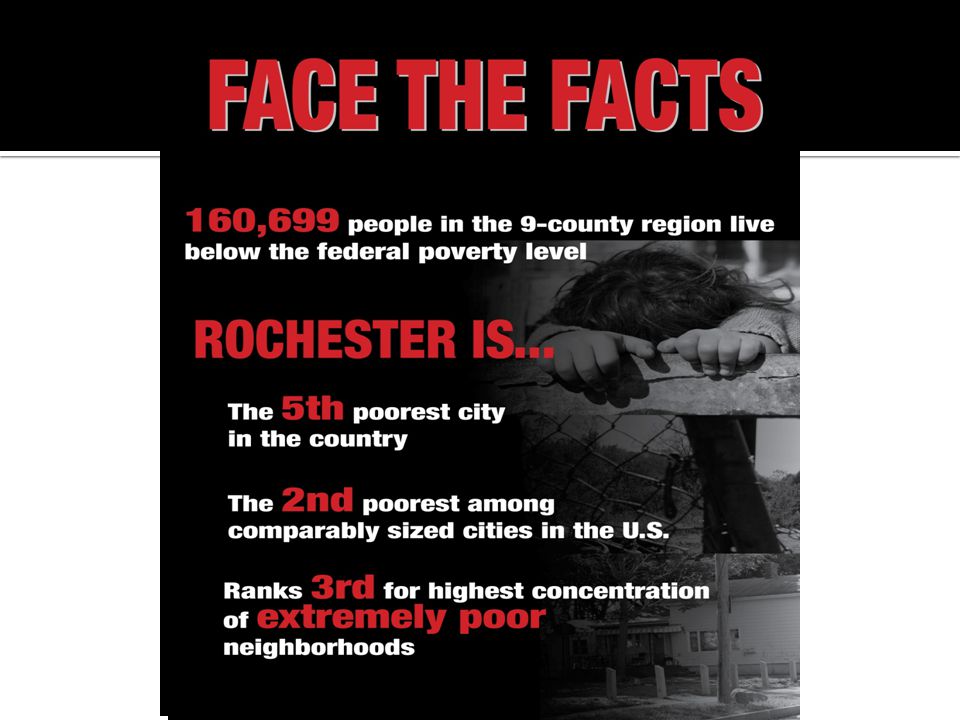
Key Findings Rochester is the 5 th poorest city in the U.S., among the top 75 metro areas. Rochester is the 2 nd poorest city of comparable size.

9
Key Findings Rochester has the 3 rd highest concentration of extremely poor neighborhoods, among the 100 largest cities.

10
Key Findings Rochester City School District students are the poorest of New York’s large urban districts. Rochester City School District students are the poorest of all 430 Upstate NY districts.

11
Additional Findings: There are about 160,000 poor people in our nine-county region. There are poor in every city, town, and village in our region

12
Additional Findings: The rate poverty is much greater for some: Group: Nine-County RegionPoverty Rate for Group Poverty Rate for All Children19%13% Female-headed, with a child under age 1840%13% African Americans34%13% Latinos33%13%

13
Additional Findings: The rate poverty is much greater for some: Group: City of RochesterPoverty Rate for Group Poverty Rate for All Children46%31% Female-headed, with a child under age 1856%31% African Americans37%31% Latinos43%31%

14
Major Conclusions The City of Rochester’s rate of poverty is alarming, and it is growing. Our region is extraordinary in its concentration of the poor.

15
Major Conclusions The incidence and concentration of poverty have major impacts on the communities where poor live. Rochester’s capacity to provide public education and other services is in serious jeopardy.

18
Major Conclusions Poverty is an impediment to regional prosperity.

22
How did we get here? Racial segregation – still considerably higher than other cities. Unregulated sprawl. Limited housing choices for the poor. Failure to Evolve.

23
Reaction and Follow Up: Excellent media coverage. Significant community interest: ▪ 800 hard copies distributed. ▪ 4,500 website hits in the first 24 hours. ▪ Numerous media mentions. ▪ Requests for presentations. ▪ E-mails and phone messages, etc..

24
Reaction and Follow Up: Presentations made or scheduled: ▪ Public follow-up session. ▪ Several nonprofit organizations. ▪ Higher education. ▪ Mayor Warren’s Senior Management Team. ▪ RBA – Executive Committee. ▪ Faith groups.

25
Reaction and Follow Up: Community Response: ▪ Report being used by Rochester Mayor Warren. ▪ Report delivered to Washington. ▪ Report to Albany. ▪ Report cited in new financial aid to Rochester. ▪ Leadership conversation being organized.

26
Where do we go from here? Expanding awareness. Achieving understanding. Taking actions.

27
How to reduce the concentration of poverty: Help people out of poverty. Provide suburban housing for more of the poor. Attract more non-poor people to the city.

28
Some Numbers: 22.3 % 18,300 23,500 83,100

29
Some Different Numbers: 22.3 % 7,500 23,300

30
Even More Numbers “the 10-10-10 plan”: 21.6 % 10,000

31
Toward a Theory of Change Awareness Understanding Consensus on the Problem (Not the solution) Setting Goals Considering Alternatives Developing Strategies Building Support Launch Assess, Correct, Persevere
 Setting Goals Considering Alternatives Developing Strategies Building Support Launch Assess, Correct, Persevere")
32
Ed’s Rule of Thirds SupportersThe MiddleOpponents

33
Available at: racf.org/Reports and ACTRochester.org

Similar presentations


3 non-profit created in 1992.>")


