Download presentation
Presentation is loading. Please wait.

1
Topic: Final Exam Review Aim: Let’s review Scientific Method and Measurement Do Now: Fill in Measurement Units Chart HW: Cells and Cell Transport Review Sheet

2
mm, cm, m, km g cm3 mL or L g/cm3 g/mL Measurement Units Length Mass
Volume of a regular solid Volume of a liquid Density of a solid Density of a liquid mm, cm, m, km g cm3 mL or L g/cm3 g/mL

4
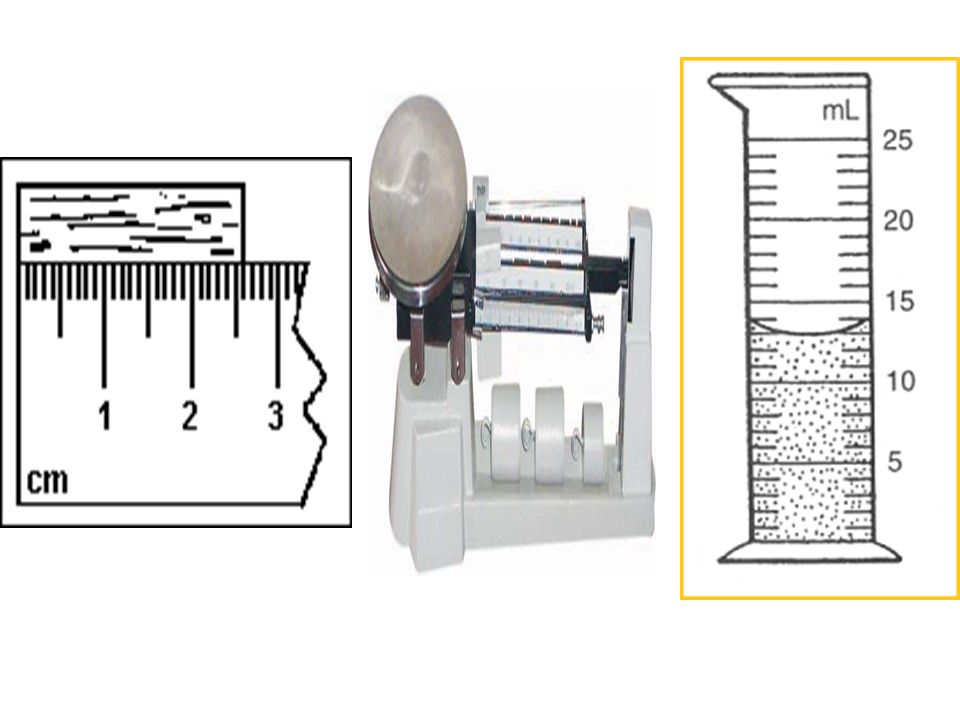
1 2 3 4 cm What is the length of the object in centimeters? Millimeters? 2.8cm 28mm

5
Mass = gm

6
Mass = 25.4 gm

10
6cm x 4cm x 3cm = 72cm3

12
A student set up the experiment shown below to determine if radish seeds take in oxygen as they germinate. Methylene blue is a chemical that is blue when oxygen is present, but is colorless when oxygen is not present. Containers A and B each contained 200 mL of water and 10 drops of methylene blue. Ten radish seeds were added to container A. Container B had no radish seeds.

13
A student examined a rock sample and described it as having particles of various colors that were 1 mm to 12 mm in size. The student was making an inference (2) a prediction (3) a hypothesis (4) an observation
 a prediction. (3) a hypothesis. (4) an observation.")
14
The purpose of container B in this experiment is to (1) serve as the control container (2) serve as the experimental container (3) show that seeds do not give off oxygen (4) show that seeds do not give off carbon dioxide
 serve as the control container (2) serve as the experimental container (3) show that seeds do not give off oxygen (4) show that seeds do not give off carbon dioxide")
15
Which statement is an inference
Which statement is an inference? (1) A thermometer shows that the air temperature is 56°F. (2) A mineral sample of galena produced a gray-black streak when tested. (3) Based on previous data, ten hurricanes may occur in the year (4) A weather vane indicates the wind is coming from the west.
 A thermometer shows that the air temperature is 56°F. (2) A mineral sample of galena produced a gray-black streak when tested. (3) Based on previous data, ten hurricanes may occur in the year (4) A weather vane indicates the wind is coming from the west.")
16
All of the liquid from a test tube is poured into a beaker, as shown in the diagram below. Compared to the liquid that was in the test tube, the liquid in the beaker has (1) a different volume, but the same shape (2) a different volume and a different shape (3) the same volume, but a different shape (4) the same volume and the same shape
 a different volume, but the same shape (2) a different volume and a different shape (3) the same volume, but a different shape (4) the same volume and the same shape .")
17
The diagram below shows water in a graduated cylinder
The diagram below shows water in a graduated cylinder. A student states that the graduated cylinder contains 150 mL of water. This statement is (1) a prediction (3) a theory (2) an observation (4) a hypothesis
 a prediction (3) a theory (2) an observation (4) a hypothesis")
18
The diagram below shows 20 grams of two different materials, A and B, on a laboratory balance. Compared to material A, material B has a different (1) density (3) phase (2) mass (4) shape
 density (3) phase (2) mass (4) shape .")
19
The diagram below shows a triple-beam balance
The diagram below shows a triple-beam balance. What is the maximum mass, in grams, that could be measured by this balance? (1) 110 (3) 610 (2) 500 (4) 1510
 110 (3) 610 (2) 500 (4) 1510")
20
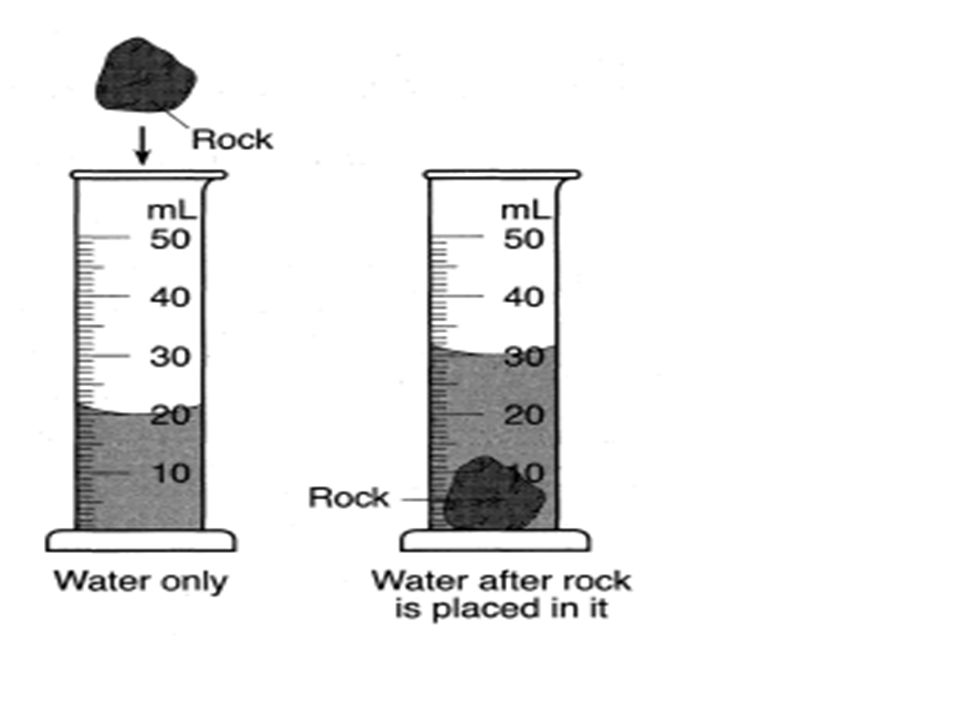
The diagram below shows a rock suspended above an overflow container filled with water up to the overflow spout. A graduated cylinder is positioned next to the container to collect water that comes out of an overflow spout. Which property of the rock can be directly determined when the rock is placed in the overflow container? (1) mass (3) volume (2) density (4) hardness
 mass (3) volume (2) density (4) hardness .")
21
A student wanted to study the amount of mold growing on pizza at different temperatures. In the experiment, the student set up four identical pans of pizza. Each pan contained the same amount of pizza. The temperatures and light conditions are shown in the data table below.

22
One error made in setting up the experiment was that the four pans of pizza
were at different temperatures (2) had different ingredients (3) were different sizes (4) received different amounts of light
 had different ingredients. (3) were different sizes. (4) received different amounts of light.")
23
The results of one experiment carried out by a research team would be considered valid if
1. the experiment had no control setup 2. all the members of the research team came to the same conclusion 3. the experiment had more than one variable 4. the experiment was repeated and the same results were obtained each time

24
Why do scientists make graphs of data from experiments?
to observe general trends and patterns in the data to make the observed data more accurate to prevent errors in measuring data to help change the original data tables

25
A new idea that is tested in a scientific experiment is known as a(an)
theory hypothesis inference observation

26
Which statement about the use of independent variables in controlled experiments is correct?
A different independent variable must be used each time an experiment is repeated. The independent variables must involve time. Only one independent variable is used for each experiment. The independent variables state the problem being tested.

27
Why do scientists consider any hypothesis valuable?
A hypothesis requires no further investigation. A hypothesis may lead to further investigation even if it is disproved by the experiment. A hypothesis requires no further investigation if it is proved by the experiment. A hypothesis can be used to explain a conclusion even if it is disproved by the experiment.

Similar presentations


 What must you do to make earning an A or B as easy as possible? 2.) What is the class website address? 3.) What are the steps.>")


 As shown in the diagram, an empty 1,000.-milliliter container has a mass of 250.0 grams. When filled with a liquid, the container and the liquid have.>")


