Download presentation
Presentation is loading. Please wait.

1
Grade Averaging and Class Ranking

2
This utility calculates grade average and class rank for the current year. The process also updates the student grade averaging record, inserting row on the grade averaging tab.

3
TEA provides no guidelines to districts for ranking their students. A district’s GPA policy is determined by its local district policy. For this reason, setting up and running Grade Averaging and Class Ranking will vary greatly between districts. The district’s GPA policy should be outlined in the Campus Student Handbook or a similar document.

4
Grade Averaging (GA) is set up in the Grade Reporting tables.
 is set up in the Grade Reporting tables.")
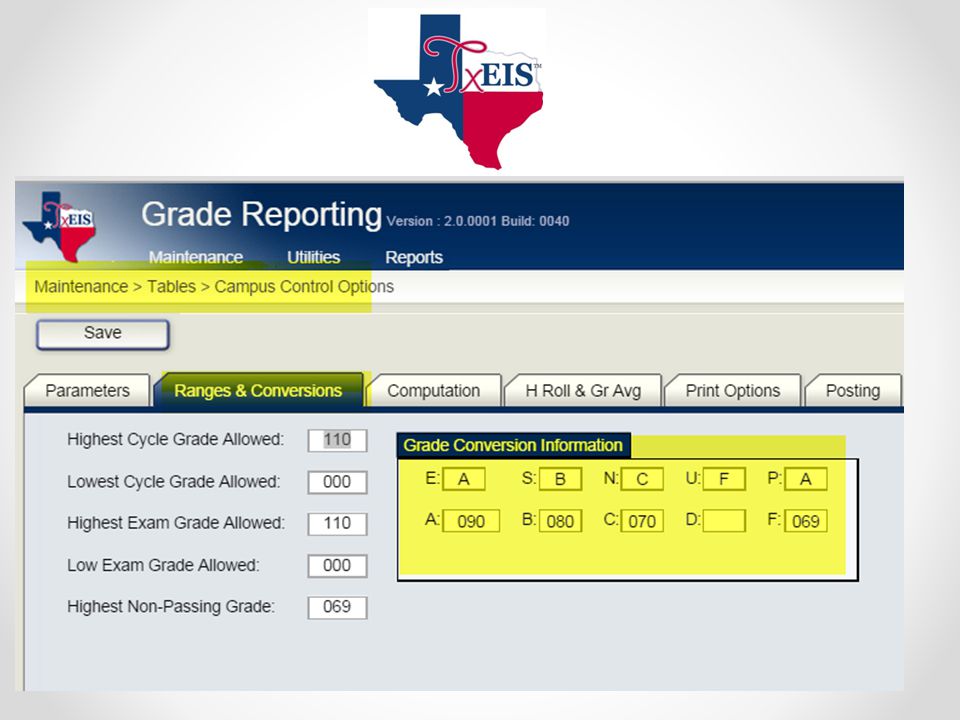
5
First, check your Campus Control Options and make sure your Ranges and Conversions are set where you want them. This is how you want the Grade Conversion Information if you want an A to be worth 4.0 grade points, a B to be worth 3.0 grade points, a C to be worth 2.0 grade points. This is how the College 4 point GPA works. It uses these ranges.

7
Select Grade Point Grade Averaging to use the grade averaging tables. GPA looks like 3.94, 2.35 OR Select Numeric Grade Averaging to use the numeric grade averaging operator/value tables. Numeric looks like 98.674, 72.123

8
Let’s look at Numeric Grade Averaging first. Using this adds points to the final grade for ranking purposes only.

10
Districts differ on how they set this up. Some districts have the categories Basic, for special ed classes, Regular, for regular classes, Honors, for honors classes, AP for advance placement classes, PreAP, for preAP classes, and others.

11
Examples are: H Honors > Adding 5 points to final grade B Basic > Subtracing 5 points from final grade AP Advanced Placement> Adding 10 points to final Grade R Regular > Not doing anything, grades are as they are

12
The extra points are added to or subtracted from the final grade. This is for the purpose of Class Ranking only and are not written on the Transcript or grade records.

13
Here is a good example: You can set a range. For example, if your average is between a 90-100, you get 10 pts added. If your average is between 70-89, you only get 5 points.

14
Remember, this should already be spelled out in your Student Handbook.

15
Let’s look at Grade Point Average now.

18
Are there any questions on setting up Numeric or Grade Point Averaging in Grade Reporting Tables?

19
Setting up the courses, or making sure they are labeled correctly is extremely important. The process will not work as intended if they are not and the calculations will not be as you intended.

20
To set up or change a course’s GA Weight or Table, go to Grade Reporting>Maintenance> Master Schedule>District Schedule

23
NOTE****** Grades of blank, I, N/G, will be adjusted to a zero for grade averaging, and the course is counted in the student’s total number of courses if the course GA Weight is not set to 0. For this reason, it is VERY IMPORTANT to print the Blank, Incomplete, Failure (SGR1000) report based on the type of grade(s) which will be used for averaging (cycle, semester, or final)
 report based on the type of grade(s) which will be used for averaging (cycle, semester, or final).")
24
Courses must be marked H for high school credit at the junior high level. Be sure to code the course consideration to J, high school level course taken at junior high. This will appear on their AAR.

25
Don’t forget to set the junior high tables!!!!

26
Most districts don’t run GPA and Class Ranking for the junior high campus, other than the high school credits, because there is really no need for it.

27
When high schools run grade averaging and class ranking, credit level H is written to students’ current year grade average rows. If the H.S. Credit Lvl Courses for Middle School field is set to Yes, the Grade Averaging and Class Ranking utility includes only courses taken for high school credit at the middle school. The credit level H courses taken at middle school are the only courses included in the student’s grade average row.

28
You will want to run the following reports to verify the GA Weight and Credit Level: SGR 0130 SRG 0100 SGR 0050

29
To run Grade Averaging and Class Ranking, go to Grade Reporting> Utilities> Grade Reporting and Class Ranking. To run for high school only, choose No for the HS Credit Lvl Courses for Middle School. To run for junior high/middle school high school credit level courses, choose Yes.

31
For the Process, choose the GA type you use. If you run both, class ranking will be applied to the last one run. There is no need to run both; some districts like to see both.

32
Next, choose the grade level(s). You can select more than one. Choose Track, and Report Sort Order.
. You can select more than one. Choose Track, and Report Sort Order.")
33
Choose Print Credit if you want the credits to be printed. If you would like Course Entry Dates verified, check the box. You have the option to Exclude Students from Ranking if they are taking a course that excludes them from Honor Roll.

34
In the Normal Max field, type the number that is used to flag students with excessive courses. If the course factor is greater than this number, an asterisk (*) prints next to the student’s course factor. The number must be two digits. If Graduated WD students are to be included in the ranking, enter the WD code.
 prints next to the student’s course factor. The number must be two digits. If Graduated WD students are to be included in the ranking, enter the WD code..")
35
Early computation can be used if the Grades Used for Grade Average field is set to S (semester) in campus control ooptions. The grade averaging and class ranking process will use the cycle grade selected in place of the last semester grade.

36
To calculate averages before the end of the school year, you may use the Early Computation feature. Some districts rank their students after the 1 st or 2 nd 6 weeks of the 2 nd semester. To do this for the 2 nd semester 1 st 6 weeks, check the first box. Choose the 2 nd box if you want to compute at the end of the 2 nd semester 2 nd cycle. Click Execute to calculate.

37
College 4 point The calculation of the College 4 pt GPA is consistent among districts all over. It is calculated differently than district GPAs. Colleges often look at this GPA instead of the district GPA because each district has their own way of determining their GPA. Set the number of decimal places in Grade Reporting.

38
The College 4 point average is calculated based on the College 4pt Scale field on the Maintenance > Tables > Campus Control Options page. The four-point average is calculated without weighting. Points are assigned according to the values for the Grade Conversion Information A, B, C, D, and F fields on the Maintenance > Tables > Campus Control Options > Ranges & Conversions tab.

39
A = 4 points B = 3 points C = 2 points D = 1 point (if using Ds) F = 0 points
 F = 0 points")
40
Algebra I954 points English I883 points History782 points IPC924 points TOTAL POINTS 13 Total Points / # of classes, so 13/4 = 3.25

41
Your turn Calculate the College GPA. Algebra 79 Biology 96 Geography 88 English 70

42
Algebra 79 2 pts Biology 96 4 pts Geo 88 3 pts English 70 2 pts 2 + 4 + 3 + 2 = 12 12 pts divided by 4 classes = 3.0 GPA

43
Now, let’s look at a District’s GPA calculation. Unlike College GPA, District GPA is much more specific. This shows grade points on a 4.0 scale. 100 = 4.0 90-99 = 3.0 – 3.9 (95=3.5, 98=3.8, 90=3.0, 92=3.2) 80-89 = 2.0 – 2.9 70-79 = 1.0-1.9 60-69 = 0 <60 = 0
 = 2.0 – = = 0 <60 = 0.")
44
2012-13English I7887 | 1.8 2.7 2013-14English II7678 | 1.6 1.8 2012-13Algebra 19592 | 3.5 3.2 2013-14Geometry8388 | 2.3 2.8 1.8+1.6+3.5+2.3 = 9.2 TOTAL 9.2 10.5 2.7+1.8+3.2+2.8 = 10.5 ___________________________________________________ 9.2 + 10.5 19.7 grade pts

45
GPA=Grade Points divided by # of grades, so, 19.7 / 8 = 2.4625

46
You try………… Find the GPA for these 2 classes. Not the College 4 point GPA.

47
2012-13English I 78 87 2013-14English II 76 78

48
78 871.82.7 76 781.6 1.8 1.8+2.7+1.6+1.8 = 7.9 7.9 / 4 = 1.975

49
Cumulative Grade Average and Class Ranking The Cumulative Grade Averaging and Class Ranking includes all high school courses (that the district designates to include). To access it, select Grade Reporting>Utilities> Cumulative Grade Averaging and Class Ranking. The following screen is displayed.

50
The number of decimal places is pre-set. Most districts do not include withdrawn students in the Average or the Rank.

51
If you are running it for High School Credit, choose H (High) under credit level.
 under credit level.")
52
If you are running it for the middle/junior high school, then click on M (Middle). Choose which process you want to run, Grade Point Average or Numeric. Remember, your district ranks students and averages grades using only one of these.

53
Select the grade level(s) you wish to run. Then, choose how you want the reports sorted. Check the boxes if you want the credits printed and the details printed for each year selected. If graduated withdrawn students are to be included, enter the WD code. Click execute.

54
The Grade Points, Average, and Ranking will appear in the student’s record in Grade Reporting>Maintenance>Student>Individual Maint., Grade Average tab.

55
This student’s GPA was run for his middle school classes in 2010 and 11. Again, Most districts do not do that. Notice The M in the first column, meaning Middle School. The system averaged all the courses with credit level M. TACY,CHRISTINA MARI

56
These highlighted rows are high school level courses. Those courses were coded with the credit level H. The G in the last column shows which process was run last, N umeric or G rade Point.

57
There was a row created for each of the school years from 7 th – 11 th grade. Notice the year 2011 has 2 rows. You can deduce that the student was in 8 th grade in 2011. He had both Middle School and High School credit level course that year. The courses that were coded High School credit for the 8 th grader could have been Algebra 1, Spanish 1, etc.

58
Notice that the Numeric Averages column all have 0s in them. Numeric Averaging was not run in this district. They ran Grade Point Averaging. Also notice the 4 Point column. This is the College 4 Point scale we discussed earlier.

59
The next to the last column shows the number of credits per year and the ranking for that school year only. The last column shows the number of students in that grade level and the rank the student was that year.

60
You can see on the bottom of the screen, this student’s cumulative GPA, including his 8 th grade high school credit level course, is a 3.46828, his cumulative rank is 7 th, the number of students ranked is 27, the date of ranking was 6/2/14, and this student is in the 2 nd quartile.

61
Any questions on Cumulative GPA?

62
Remember, to run GPA correctly, you need to see what the district’s handbook says and have all courses coded that way. They may be Regular, Honors, Basic, AP, or other kinds of courses. Most districts weight the GA weight as 1, meaning the course grade counts only 1 time.

63
The tables in Grade Reporting must be set up correctly. I suggest you start from 100 (unless your highest grade allowed is something different, like 105 or 110) and number all the way down to 0 so there is no doubt what each grade is worth. If a grade is not listed, it gets 0 grade points for Grade Point Average. It is a good idea to hand calculate the top two student’s GPA to make sure everything has been setup correctly in the system.
 and number all the way down to 0 so there is no doubt what each grade is worth. If a grade is not listed, it gets 0 grade points for Grade Point Average. It is a good idea to hand calculate the top two student’s GPA to make sure everything has been setup correctly in the system..")
64
If you do not use TxEIS to calculate your GPA but want to start, you would start with this year, 14-15 using TxEIS, but manually get grade points for the previous years. You can enter values into a spreadsheet and have it calculate for you, then manually enter them into each row.

65
Thank you for attending this workshop!! Are there any questions?

Similar presentations


 earn credits. Students who fail classes may not have enough.>")


>")


