Download presentation
Presentation is loading. Please wait.

1
Dixie Heights High School Freshman Academy The Journey Brennon Sapp Thad Dusing

2
Only one in five repeat freshman graduate high school (Kenton County Numbers)
")
5
Jobs? Nearly 75% of high school graduates enter college, but only 12% of these students will complete a significant college degree. (US Dept. of Ed) For students who complete high school, only six in 10 will obtain a job For students who drop out, only three in 10 will obtain a job. (Alliance for Excellence in education)
 For students who complete high school, only six in 10 will obtain a job For students who drop out, only three in 10 will obtain a job. (Alliance for Excellence in education).")
6
Salary? Assuming that each works until age 65 and earns the average salary A high school graduate will earn nearly $333,000 more than a dropout, A student with a college degree will earn $538,000 more than a high school graduate (Alliance for Excellence in education)
.")
7
Salaries US Department of Commerce Average Earnings 1999 Average Earnings 2006 High School Dropout$21,035$21,788 High School Graduate$28,184$30,940 Some College$29,221$35,048 College-Associate Degree$32,638$37,492 College Graduate with Bachelor’s $44,985$50,024 College Graduate with Master’s $49,085$59,280 Professional$75,000$76,648

8
Cost of the Non-educated? 82% of prisoners in America are high school dropouts (National Dropout Prevention Network) Currently it cost $18,000 a year to keep an individual in prison (Duke University) Half of the heads of households on welfare are high school dropouts (National Center for Education Statistics) Welfare benefits cost taxpayers $23 million a day (Ministry of Social Development)
 Currently it cost $18,000 a year to keep an individual in prison (Duke University) Half of the heads of households on welfare are high school dropouts (National Center for Education Statistics) Welfare benefits cost taxpayers $23 million a day (Ministry of Social Development).")
9
Why do Students Drop Out The number one reason “I wasn’t learning anything” The number two reason “I hate school” Nine in ten students say they would work harder if their high school expected more of them. (Gates foundation)
.")
10
Why do Students Drop Out 50 percent said they left school because their classes were boring and not relevant to their lives schools did not motivate them to work hard Four years later, 74 percent of high school dropouts said they would have stayed in school if they had to do it over again (Gates foundation)
")
11
Regarding Competitive Advantage “If you look at India, China, and Russia… even if you discount 90 percent of the people there as uneducated…you still end up with about 300 million people who are educated. That’s bigger than the U.S. work force.” Bob Herbert, New York Times

12
Job Market The twelve fastest growing job markets are technology and/or related to health care. The fastest declining job markets are secretaries, typist, phone operators, tellers, clerks computer operators, farmers, and ranchers. Why?

13
Global Concerns China produced 2.12 Million college graduates last year-over half are applying for US jobs 2/3 of all science and math workers/teachers will retire in the next five years By 2010 China will graduate more PhDs in science and engineering than the United States By 2010 over half the worlds Bio-Tech graduates will live in India Business and Economy

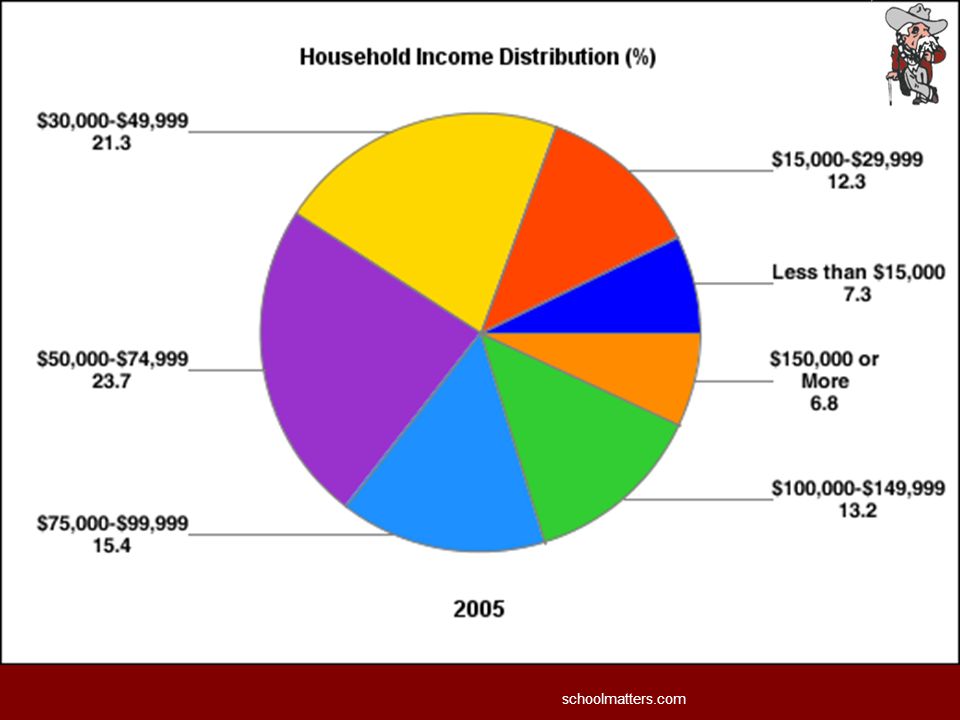
16
schoolmatters.com

18
What is the job of a Teacher? To teach? To help students learn? To give students experience? To motivate? ?

19
Are we responsible for what a student knows/can do a year from know?

20
What is the Job of Freshman Academy? 1. Help students learn (by any means possible) Learn the Core Content Earn good grades Develop a joy of learning 2. Successfully transition students from the middle school to the high school Earn good grades Develop good habits Experience Schools of Study
 Learn the Core Content Earn good grades Develop a joy of learning 2. Successfully transition students from the middle school to the high school Earn good grades Develop good habits Experience Schools of Study.")
21
Our Message to Students We will do what we can to make learning easy, interesting, and enjoyable. We will be an annoying presence in your life until we see positive results. We will not relent!

22
Freshman Academy Goals Improve Attendance Improve Retention Rate Improve Failure Rate Improve Discipline

23
Is this us? Not really.

24
Needed Time McREL 15,465 Hours Available Time 9,042Hours

26
Year One Establish Academy Choose teachers Create Remediation Program Create Homework Hotline

27
Year Two Common Planning Periods Established Parent Conference Day Created 4th Quarter SWS

28
Year Three Create Freshman Coordinator position Establish Freshman Wing in building Freshman Success Guide created Freshman Administrator assigned Camp Dixie Day “Colonel Character” Cards Reward Field Trip Pathway Advisor program Honors Assembly Teacher WebPages Gender-based PE/Health PD on Adolescent Development Mandatory Tutoring Busses

29
Freshman Coordinator Meet with students (be a parent) Contact Parents Stage interventions Work with teachers and students for alternative education options Prepare for transitions into and out of the academy “Hug all the trees”
 Contact Parents Stage interventions Work with teachers and students for alternative education options Prepare for transitions into and out of the academy Hug all the trees")
30
Take an active role in FRAC development Must know teachers-how classes work Handle all freshman discipline (be visible) Prepare for the future of the academy (lead meetings and PD Be responsible for change and movement Give directives and goals for the Academy to move toward Make decisions when necessary Data, Accountability, and Data Freshman Administrator
 Prepare for the future of the academy (lead meetings and PD Be responsible for change and movement Give directives and goals for the Academy to move toward Make decisions when necessary Data, Accountability, and Data Freshman Administrator")
33
Tracking Data Average of failing students Average of failing Sp Ed Students Failing Sp Ed Failing 1 Failing 2 Failing 3 Failing 4 Failing 5 Failing 6 Bailey15 3 11634 58%66% 65%67%66%49%47% Chevalier0 Frodge3 2 21 52%49% 50%57% Newman33 5 776661 55%54% 59% 60%48%51%19% Nieport16 3 282121 53%49% 67%53%55%49%50%30% Ring11 3 4241 60%55% 64%62%55%59% Schmidt31 5 477661 56%51% 65%57%61%51%52%29% Spritzky20 1 52652 60%65% 60%61%67%55%56% Wischer11 4 23231 59%61% 46%67%62%59%54% Special Ed 11 22421 53% 56%55%54%53%45% Average of students in failing classes 61%57%59%52%51%39%

34
Tracking Data Failing 1 Failing 2 Failing 3 Failing 4 Failing 5 Failing 6 331715761 309FA Students 79Students Failing at least one class 25.57 % Students failing at least one class 11 Special Ed Students Failing at least one class 176 Total Classes Failed 140 Academy Classes Failed79.5% of Failures are Academy Classes 36Elective Classes Failed20.5% Failures are Electives

35
Students FailingChange from Previous Week Bailey20-8 Bredemeyer1- Brown0- Chevalier0- Dennler2- Frodge12-12 Hooper0-7 Huff0- Levack4-2 Lutz1- Meyer4-5 Newman29 Nieport14-2 Reed4 Richards-- Ring17-10 Roberts0-5 Schatzman1 Schmidt26-12 Spritzky17-18 Tucker4 Wadsworth9-4 Welch10 Wischer4-6

36
A’s & B’s?

37
Our Losses This Year 21 Freshman have been “lost” currently (left us under poor conditions) 42 freshman are expected to be freshmores Thus we should expect 50 of these students to not graduate.
 42 freshman are expected to be freshmores Thus we should expect 50 of these students to not graduate.")
38
What about the future of FRAC? Teams (of 4) Common Plans Common Methods Grading Policies Home Work Hotline Late Policy Classroom Procedures Similar Syllabi Folders/Agendas/”Yellow Slips” Student-Team Interventions
 Common Plans Common Methods Grading Policies Home Work Hotline Late Policy Classroom Procedures Similar Syllabi Folders/Agendas/ Yellow Slips Student-Team Interventions.")
39
Pitfalls Prepare, prepare, prepare Put someone in charge Choose Staff carefully Train Staff on adolescent and gender development Maintain high staff moral Strong transition plan with the middle school Give power to the teachers (monitor) Data, Research, & Data
 Data, Research, & Data")
40
Next Year?? Trimesters Separate Teams Course placement determined by math and English assessments

41
Next Year?? Teams Common Plans Common Methods Grading Policies Home Work Hotline Late Policy Classroom Procedures Similar Syllabi Folders/Agendas/”Yellow Slips” Teacher Development and Growth

42
Questions & Contacts brennon.sapp@kenton.kyschools.us brennon.sapp@kenton.kyschools.us thad.dusing@kenton.kyschools.us thad.dusing@kenton.kyschools.us http://www.dixie.kenton.kyschools.us/FAC/ http://www.dixie.kenton.kyschools.us/FAC/

Similar presentations


 Camps, 2011.>")


