Download presentation
Presentation is loading. Please wait.

1
Optimal Health Insurance Revenue Structure Young Jun Chun Hanyang Univ., Seoul, Korea November, 2014

2
Motivation Increasing dependence of health insurance revenue on subsidy from other sectors of government – Rapid increase in health insurance (HI) expenditure due to population aging – Population aging also reduce revenue base for HI contribution
 expenditure due to population aging – Population aging also reduce revenue base for HI contribution")
4
More dependence on the government subsidy means: – Reducing labor income tax – Increasing capital income tax and consumption tax – Because: HI contribution is typically imposed on labor income (or non-capital income) The source of the government subsidy is tax revenue, which consists of labor income tax, capital income tax, and consumption tax.
 The source of the government subsidy is tax revenue, which consists of labor income tax, capital income tax, and consumption tax.")
5
Economic effects of the tax base change – Any possibility of increase in the health expenditure? – From political economy perspective (Persson and Tabellini (1999)): Tax burden is generally progressive. HI contribution is generally regressive, because of the existence of income ceiling for HI contribution imposition. Revenue-neutral increase in tax-financing will reduce the median voter’s fiscal burden, which will make her vote for larger HI expenditure.
): Tax burden is generally progressive. HI contribution is generally regressive, because of the existence of income ceiling for HI contribution imposition. Revenue-neutral increase in tax-financing will reduce the median voter’s fiscal burden, which will make her vote for larger HI expenditure..")
7
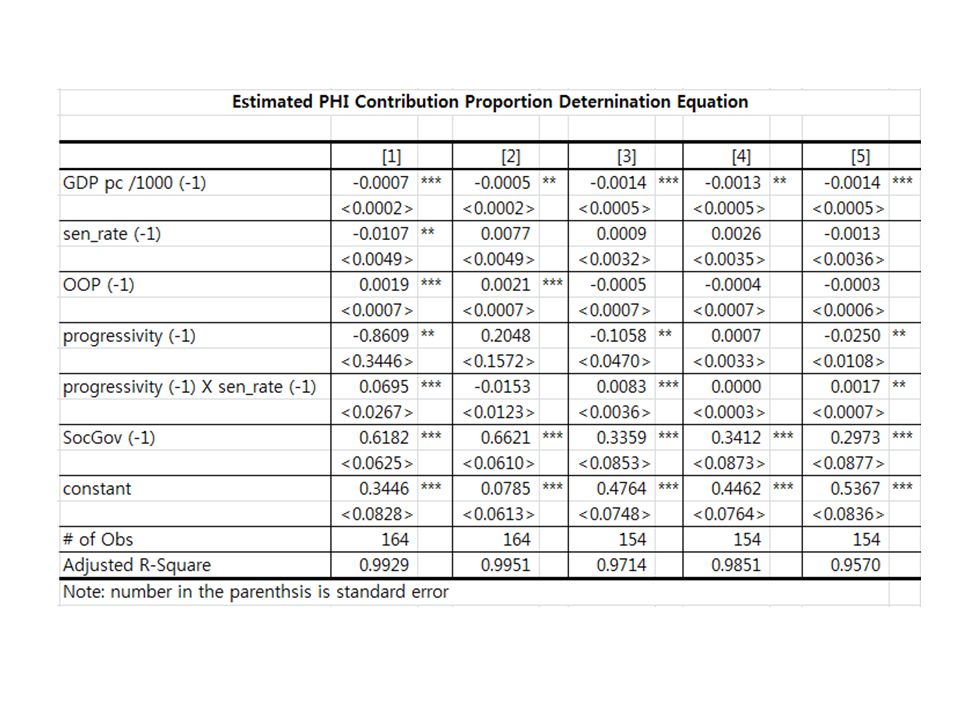
Two Hypotheses: (A)Proportion of PHI-contribution-financing has positive relationship with public (or national) health expenditure. (B) Proportion of PHI-contribution-financing is negatively related with progressivity. Related with Median Voter Theorem
 Proportion of PHI-contribution-financing is negatively related with progressivity. Related with Median Voter Theorem.")
8
Estimation Equations National Health Expenditure and Public Health Expenditure – Fixed Effect Model with year dummies – 2 stage estimation – IV: PHI contribution proportion (Sov_Gov) Possibility of endogeneity Government may adjust based on the projected increase in public health expenditure
 Possibility of endogeneity Government may adjust based on the projected increase in public health expenditure")
10
Dependent variables: – National health expenditure (Tot_Exp_GDP) – Public health expenditure (Pub_Exp_GDP) Independent variables: – GDP_pc: GDP per capita – Sen_rate: proportion of the aged 65 and older – OOP: proportion of out-of-pocket money – Soc_gov: share of HI fund in public health expenditure – Gov_Exp: public health expenditure share in national health expenditure
 – Public health expenditure (Pub_Exp_GDP) Independent variables: – GDP_pc: GDP per capita – Sen_rate: proportion of the aged 65 and older – OOP: proportion of out-of-pocket money – Soc_gov: share of HI fund in public health expenditure – Gov_Exp: public health expenditure share in national health expenditure")
11
Independent variables – continued- – Year dummy: – Tax Progressivity (1)Difference between before-tax and after-tax Gini (Musgrave and Thin (1948), [1]) (2)Kakwani (1991) index: ([2]) (3)Income elasticity of tax burden ([3]) (4)Difference in effective average income tax rate between 67%-of-average-income earner and 167%-of-average- income earner ([4]) (5) Difference in effective average income tax rate between 67%-of-average-income earner and 100%-of-average- income earner ([5])
![Independent variables – continued- – Year dummy: – Tax Progressivity (1)Difference between before-tax and after-tax Gini (Musgrave and Thin (1948), [1]) (2)Kakwani (1991) index: ([2]) (3)Income elasticity of tax burden ([3]) (4)Difference in effective average income tax rate between 67%-of-average-income earner and 167%-of-average- income earner ([4]) (5) Difference in effective average income tax rate between 67%-of-average-income earner and 100%-of-average- income earner ([5])](http://images.slideplayer.com/12/3566195/slides/slide_11.jpg "Independent variables – continued- – Year dummy: – Tax Progressivity (1)Difference between before-tax and after-tax Gini (Musgrave and Thin (1948), [1]) (2)Kakwani (1991) index: ([2]) (3)Income elasticity of tax burden ([3]) (4)Difference in effective average income tax rate between 67%-of-average-income earner and 167%-of-average- income earner ([4]) (5) Difference in effective average income tax rate between 67%-of-average-income earner and 100%-of-average- income earner ([5])")
15
Estimation Results The increase in the tax-financing or more dependence on the subsidy from other sectors of the general government is likely to increase the health care expenditure. – Median Voter Theorem underlies the result. Then, what is its effect on the welfare?

16
Identification of optimal HI revenue structure (General Equilibrium Model Approach) – Increase in tax-financing increases the health expenditure, which increases the tax burden. – The resulting Health expenditure increase improves the health (McGuire (2000)) – Growth effect of revenue neutral increase in tax- financing improves social welfare (Chun (2012))
) – Growth effect of revenue neutral increase in tax- financing improves social welfare (Chun (2012)).")
17
General Equilibrium Model Overlapping Generations Model – Life expectancy: 80 years – 12 periods: 5-year period Household sector – 10 lifetime income classes – Decision-making: Consumption Health care service

18
– Risks in health With Prob=prL a, she becomes ill. With Prob=prR a, the sick recover. Lose utility SH in money term Health service purchase partially compensates for the loss of utility due to illness. – Utility When healthy : When sick:

19
Physicians – Maximize pecuniary profit – disutility from effort.

20
H, ε are jointly decided by the sick and the physician (Nash equilibrium). – Public health insurance parameters affect this joint decision. Coinsurance rate Lump-sum payment to physician Part of cost-sharing physician

21
Firms – Constant returns to scale production technology – Production Factor: labor supply – Perfect competition

22
Government – Provide public health insurance (PHI) system. – Balanced budget Lump-sum payment to physician + Fee for service = PHI contribution + Tax revenue – Taxes Progressive income tax Proportional consumption tax Proportional PHI contribution

23
Flow of decisions

24
Issues Identification of optimal PHI contribution proportion – The existence of progressive income taxation induce heterogeneous effect of PHI contribution proportion across income classes and age groups. Effect of tax revenue proportion – The proportion affects the progressivity of tax burden across classes and age groups

25
Effect of population aging – As population ages, the median voter is getting older. – PHI contribution is typically not imposed on the older age groups. – In extremely old society, the increase in the tax- financing may reduce PHI expenditure.

Similar presentations