Download presentation
Presentation is loading. Please wait.

1
Global Climate Models Johannes Feddema Department of Geography The University of Kansas

2
Outline Global Climate Models and Climate Change (Some) History of climate science What is a Model? Basics of the climate system Climate model components Climate boundary conditions Human impacts on climate Future Climate simulations Skeptics/deniers and models

3
CLIMATE SCIENCE

4
Conceptual framework for climate studies

5
Global Climate Observing System – Early days Sources: http://en.wikipedia.org/wiki/Thermometer http://inventors.about.com/b/2004/11/16/the-history-behind-the-thermometer.htm www.nature.com http://www.geocities.com/Yosemite/Rapids/7592/Stevenson.jpg Thermoscope Thermometer Greeks (density and energy) 11 th Century Avicenna 15?? -1603 Galileo (thermoscope) 1613 – Segredo/Santorio (thermometer)? 1714 Fahrenheit (Mercury) 1742 Celsius (Centigrade Scale) 1853 1 st Meteorological Conference
 1613 – Segredo/Santorio (thermometer) Fahrenheit (Mercury) 1742 Celsius (Centigrade Scale) st Meteorological Conference.")
6
1853 First International Meteorological Conference (standardization of instruments) 1873 WMO's predecessor, the International Meteorological Organization (IMO) established 1882 Launch of the First International Polar Year 1882-1883 1932 Launch of the second International Polar Year 1932-1933 1951 WMO established as a specialized agency of the United Nations 1957 Launch of International Geophysical Year 1957-1958 Milestones of the WMO Source WMO
 1873 WMO s predecessor, the International Meteorological Organization (IMO) established 1882 Launch of the First International Polar Year Launch of the second International Polar Year WMO established as a specialized agency of the United Nations 1957 Launch of International Geophysical Year Milestones of the WMO Source WMO")
7
Conceptual or Descriptive models Description or understanding of general relationships Physical models Simplified physical replicas of more complex systems e.g. scale models (globe, cars, buildings, rivers etc.) Modeling Concepts Conceptual or Descriptive
 Modeling Concepts Conceptual or Descriptive.")
8
from EPA/RTP WIND TUNNEL

9
Conceptual or Descriptive models Description or understanding of general relationships Physical models Simplified physical replicas of more complex systems e.g. scale models (cars, buildings, rivers etc.) Mathematical models Deterministic – exact relationships Parameterized – generalized relationships e.g. correlation and regression Stochastic – contains a random component Can incorporate Feedback systems. Modeling Concepts
 Mathematical models Deterministic – exact relationships Parameterized – generalized relationships e.g. correlation and regression Stochastic – contains a random component Can incorporate Feedback systems. Modeling Concepts.")
10
Parameterized model: Regression

11
This and next three are from A. HUBER, EPA/RTP Modeling Concepts

12
What is Climate Science What is Modern Climate Science Understanding of the movement of energy into, through, and out of the Earth System Based on physics through the processes of: Electromagnetic radiation Convective heating of the Atmosphere (sensible heat) Convective transport of water vapor
 Convective transport of water vapor")
13
z 342 324 390 165 40 235 30 0 78 24 67 107 30 77 168 Surface Energy Balance: 168 = 390 – 324 + 24 + 78 Top of Atmosphere Energy Balance: 342 – 107 = 235 Sensible Heat Latent Heat Evapo- transpiration Conduction Long-wave Radiation from Clouds Long-wave Radiation from Atmosphere Long-wave Radiation Atmospheric Window Longwave Radiation Absorbed by Atmosphere Longwave Radiation Emmited by Surface Long-wave Radiation Emitted by Atmosphere 350 Outgoing Long-wave Radiation Thermal heating Incoming Solar Radiation Shortwave Reflected Shortwave radiation by Clouds Aerosols and Gases Reflected Shortwave radiation by Surface Absorbed Shortwave radiation by Surface Absorbed Shortwave radiation by Atmosphere Reflected Shortwave radiation Global Average Energy Balance Atmosphere Energy Balance: 67 + 350 + 24 + 78 = 324 + 165 + 30

14
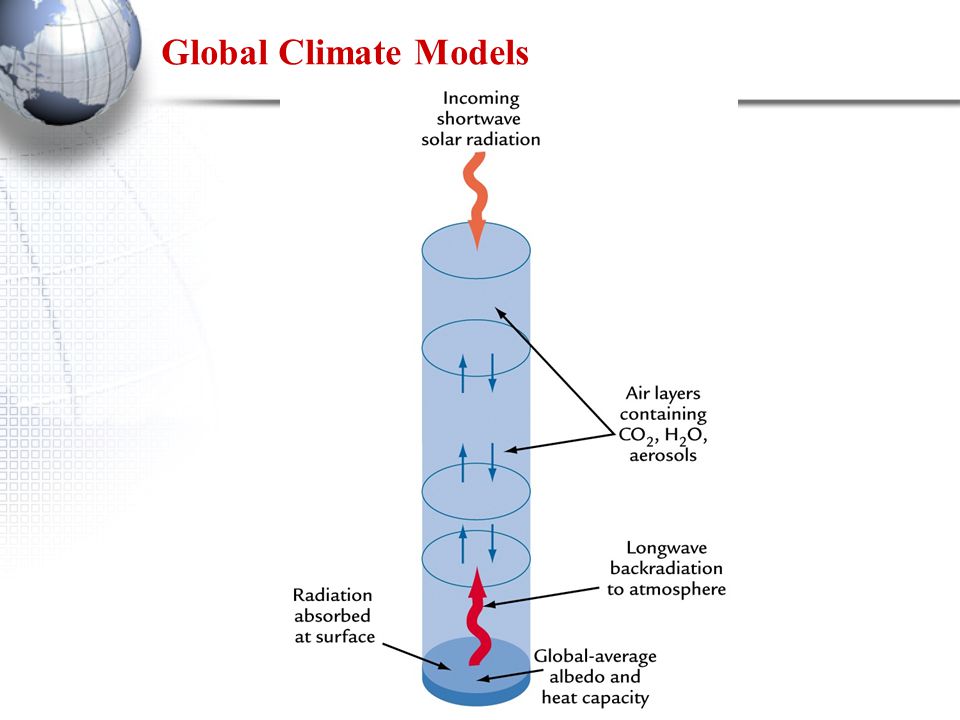
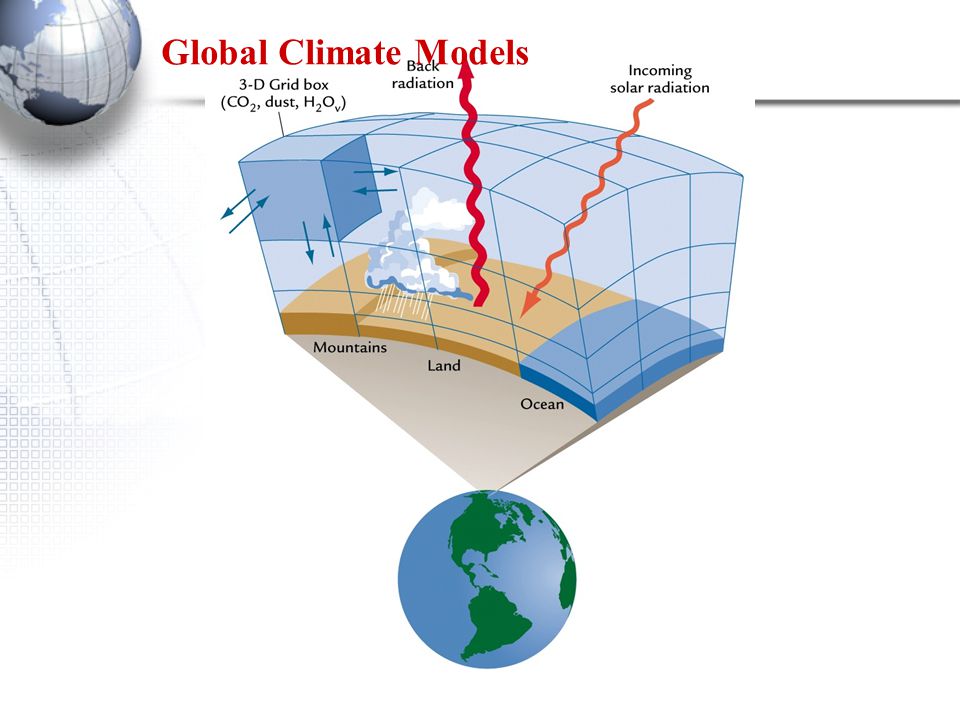
Global Climate Models

18
The NCAR Community Climate System Model (CCSM) Global Climate Models
 Global Climate Models")
19
R15T42 T85 T170 Model Resolutions

20
(300 km) (150 km) (75) km (37 km) Climate Model Resolution
 (150 km) (75) km (37 km) Climate Model Resolution")
21
Climate Models

22
Hydrology Drainage Canopy Water Evaporation Interception Snow Melt Sublimation Throughfall Stemflow Infiltration Surface Runoff Evaporation Transpiration Precipitation Soil Water Redistribution Ocean Lake Snow Soil Water Ground Water Catchment Hydrology And River Flow Surface Runoff Direct Solar Radiation Absorbed Solar Radiation Diffuse Solar Radiation Longwave Radiation Reflected Solar Radiation Emitted Long- wave Radiation Sensible Heat Flux Latent Heat Flux uaua 0 Momentum Flux Wind Speed Soil Heat Flux Heat Transfer Photosynthesis Biogeophysics NCAR Community Land Model

23
Climate Models

24
glacier 16.7% lake 16.7% urban 8.3% wet- land 8.3% vegetated 50% NET temperate 45% 15 Plant Functional Types Needleleaf evergreen tree temperate boreal Needleleaf deciduous tree Broadleaf evergreen tree tropical temperate Broadleaf deciduous tree tropical temperate boreal Shrub broadleaf evergreen, temperate broadleaf deciduous, temperate broadleaf deciduous, boreal Grass C 3, arctic C 3 C 4 Crop 15% BDT temperate 25% C 3 grass 15% Each patch has unique: PFT composition PFT abundance leaf area height biomass Additional grid-cell data: land fraction soil color soil texture (% sand, % clay, mineral composition) Additional data: ½º river network Community Land Model Surface Datasets 114 cm 91 cm 55 cm 34 cm 20 cm 12 cm 8 cm 5 cm 3 cm 2 cm Soil Profile total depth - 343 cm 10 layers texture varies with depth Up To 4 Patches
 Additional data: ½º river network Community Land Model Surface Datasets 114 cm 91 cm 55 cm 34 cm 20 cm 12 cm 8 cm 5 cm 3 cm 2 cm Soil Profile total depth cm 10 layers texture varies with depth Up To 4 Patches")
25
Atmospheric Forcing An Urban Sub-model in the CLM W Impervious Pervious H Roof Sunlit Wall Shaded Wall Canyon Floor Canopy Air Space

26
Timeline of Climate Model Development

27
Climate Change

28
Climate Change Science What do we need to know? Is the climate changing Observations Reference conditions Climate change attribution What is causing it to change Climate projections What does theory tell us about the future

29
Background: Human Climate Interactions Natural and human impacts on the climate system Agriculture Grazing Natural Vegetation? Urban De/Re-forestation Soil Degradation Atmospheric Composition Solar Variation

30
WHAT ABOUT SOLAR ACTIVITY?

31
Natural Forcing over the last decades Sources: Globalwarmingart.com

33
Sources: Globawarmingart.com www.globalwarmingart.com/wiki/Image:Sunspot_Numbers_png Hoyt and Schatten (1998a) Solar Physics 179: 189-219. Hoyt, and Schatten (1998b) Solar Physics 181: 491-512. Stott et al. (2003) Journal of Climate 16: 4079-4093.
 Solar Physics 181: Stott et al. (2003) Journal of Climate 16:")
34
Long term Solar and Temperature trends Sources: Globalwarmingart.com

35
HISTORICAL FORCINGS

36
Source: World Resources 2000-2001 Time Magazine – 9 April 2001 Climate Forcing (Anthropogenic)
")
37
So what are we worried about? Humans develop as species { 1900 1958 2005 Ice Age Present Future? 1900 Rate = +0.7 ºC 100yrs 0.7 ºC 100 years Rate ≈ +0.036 ºC 100yrs 5-8 ºC 18,000 years Rate – Depends on: response time? feed backs? Last Glacial Maximum Domestication of plants and animals Industrial revolution begins

38
Relationships between GHGs and Temperature

39
What about the distant past? Permian Crash Extinction of Dinosaurs Terrestrial plants But it was a different world Sources Globalwarmingart.com www.globalwarmingart.com/wiki/Image:Phanerozoic_Carbon_Dioxide_png Bergman etaal (2004). American Journal of Science 301: 182-204. Berner and Kothavala (2001). American Journal of Science 304: 397–437. Gradstein, FM and JG Ogg (1996). Episodes 19: 3-5. Gradsteinet al. (2005). A geologic time scale 2004. Camb. Univ. Press Rothman (2001) Proc. of the Nat. Academy of Sciences 99 (7): 4167-4171. Royer, et al. (2004) GSA Today www.scotese.com
. American Journal of Science 301: Berner and Kothavala (2001). American Journal of Science 304: 397–437. Gradstein, FM and JG Ogg (1996). Episodes 19: 3-5. Gradsteinet al. (2005). A geologic time scale Camb. Univ. Press Rothman (2001) Proc. of the Nat. Academy of Sciences 99 (7): Royer, et al. (2004) GSA Today")
40
WHAT EXACTLY DOES CO 2 DO?

41
Effects of CO2 on Energy Balance Sources: Globalwarmingart.com www.globalwarmingart.com/wiki/Image:Atmospheric_Transmission_png Gordley et al. (1994). J..Quant. Spect. & Rad. Trans. 52 (5). Kiehl and Trenberth (1997) Bull. Am. Meteor. Assoc. 78. Lashof (1989). Climatic Change 14 (3): 213-242. Rothman et al. (2004). J..Quant. Spect. & Rad. Trans. 96. Peixoto and Oort (1992). Physics of Climate. Springer
. J..Quant. Spect. & Rad. Trans. 52 (5). Kiehl and Trenberth (1997) Bull. Am. Meteor. Assoc. 78. Lashof (1989). Climatic Change 14 (3): Rothman et al. (2004). J..Quant. Spect. & Rad. Trans. 96. Peixoto and Oort (1992). Physics of Climate. Springer.")
42
z 342 324 390 165 40 235 30 0 78 24 67 107 30 77 168 Surface Energy Balance: 168 – 324 = 390 + 24 + 78 + 0 Top of Atmosphere Energy Balance: 342 – 107 = 235 Sensible Heat Latent Heat Evapo- transpiration Conduction Long-wave Radiation from Clouds Long-wave Radiation from Atmosphere Long-wave Radiation Atmospheric Window Longwave Radiation Absorbed by Atmosphere Longwave Radiation Emmited by Surface Long-wave Radiation Emitted by Atmosphere 350 Outgoing Long-wave Radiation Thermal heating Incoming Solar Radiation Shortwave Reflected Shortwave radiation by Clouds Aerosols and Gases Reflected Shortwave radiation by Surface Absorbed Shortwave radiation by Surface Absorbed Shortwave radiation by Atmosphere Reflected Shortwave radiation Global Average Energy Balance 39 234 3512 1 166 326 79 391 Atmosphere Energy Balance: 67 + 350 + 24 + 78 = 324 + 165 + 30 235 352 16679326352 79 391326

43
USING MODELS TO GIVE US ANSWERS

45
Climate Simulation: How good are the models?

46
Recent Climate Variable Trends: Observations Sources: Globawarmingart.com www.globalwarmingart.com/wiki/Image:Short_Instrumental_Temperature_Record_png Brohan, et al. (2006) J. Geophaysical Research 111: D12106 Luo etal. (2002 J Clim 15: 2806-2820 Sources: Globawarmingart.com www.globalwarmingart.com/wiki/Image:Solar_Cycle_Variations_png Irradiance:/www.pmodwrc.ch/pmod.php?topic=tsi/composite/SolarConstant International sunspot number:/www.ngdc.noaa.gov/stp/SOLAR/ftpsunspotnumber.html Flare index: www.koeri.boun.edu.tr/astronomy/readme.html 10.7cm radio flux: www.drao-ofr.hia-iha.nrc-cnrc.gc.ca/icarus/www/sol_home.shtml
 J. Geophaysical Research 111: D12106 Luo etal. (2002 J Clim 15: Sources: Globawarmingart.com Irradiance:/ topic=tsi/composite/SolarConstant International sunspot number:/ Flare index: cm radio flux:")
47
T. Barnett and D. Pierce of SIO Climate Simulation: Ocean Response

48
Abrupt Transitions in the Summer Sea Ice Observations Simulated 5-year running mean Gradual forcing results in abrupt Sept ice decrease Extent decreases from 70 to 20% coverage in 10 years. “Abrupt” transition Impacts of Climate Change – Sea Ice Extent Sources NSIDC NCAR Simulated Observed Greenland Russia Scandinavia Alaska Canada Alaska Greenland Russia

49
Role of the IPCC

50
1853 First International Meteorological Conference (standardization of instruments) 1873 WMO's predecessor, the International Meteorological Organization (IMO) established 1882 Launch of the First International Polar Year 1882-1883 1932 Launch of the second International Polar Year 1932-1933 1951 WMO established as a specialized agency of the United Nations 1957 Launch of International Geophysical Year 1957-1958 Global Ozone Observing System set up 1963 World Weather Watch launched 1976 WMO conducts first international assessment of the state of global ozone 1979 First World Climate Conference held which led to the establishment of the World Climate Programme 1985 Vienna Convention on the Protection of the Ozone Layer 1987 Montreal Protocol on Substances that Deplete the Ozone Layer 1988 WMO/UNEP Intergovernmental Panel on Climate Change established 1989 Global Atmosphere Watch established to monitor atmospheric composition WMO and UNEP initiate the process leading to the UN Framework Convention on Climate Change 1990 Second World Climate Conference initiates the Global Climate Observing System First Assessment Report of the IPCC 1991WMO/UNEP begin process which led to negotiation of the UN Framework Convention on Climate Change 1992 UN Conference on Environment and Development (the 'Earth Summit') leads to Agenda 21 1995 Second Assessment Report of the Intergovernmental Panel on Climate Change 1997El Nino/Southern Oscillation warm episode and severe weather events across the world 1998 Kyoto Conference establishes timetable for reduction of greenhouse gas emissions 2001 Third Assessment Report of the Intergovernmental Panel on Climate Change 2002 World Summit on Sustainable Development (Johannesburg, South Africa) 2007 Bali Conference Fourth Assessment Report of the Intergovernmental Panel on Climate Change IPCC awarded Nobel Prize Milestones of the WMO Source WMO
 1873 WMO s predecessor, the International Meteorological Organization (IMO) established 1882 Launch of the First International Polar Year Launch of the second International Polar Year WMO established as a specialized agency of the United Nations 1957 Launch of International Geophysical Year Global Ozone Observing System set up 1963 World Weather Watch launched 1976 WMO conducts first international assessment of the state of global ozone 1979 First World Climate Conference held which led to the establishment of the World Climate Programme 1985 Vienna Convention on the Protection of the Ozone Layer 1987 Montreal Protocol on Substances that Deplete the Ozone Layer 1988 WMO/UNEP Intergovernmental Panel on Climate Change established 1989 Global Atmosphere Watch established to monitor atmospheric composition WMO and UNEP initiate the process leading to the UN Framework Convention on Climate Change 1990 Second World Climate Conference initiates the Global Climate Observing System First Assessment Report of the IPCC 1991WMO/UNEP begin process which led to negotiation of the UN Framework Convention on Climate Change 1992 UN Conference on Environment and Development (the Earth Summit ) leads to Agenda Second Assessment Report of the Intergovernmental Panel on Climate Change 1997El Nino/Southern Oscillation warm episode and severe weather events across the world 1998 Kyoto Conference establishes timetable for reduction of greenhouse gas emissions 2001 Third Assessment Report of the Intergovernmental Panel on Climate Change 2002 World Summit on Sustainable Development (Johannesburg, South Africa) 2007 Bali Conference Fourth Assessment Report of the Intergovernmental Panel on Climate Change IPCC awarded Nobel Prize Milestones of the WMO Source WMO")
51
Role of the IPCC- Coordination TSU = Technical Support Unit

52
IPCC -- Coordinating research efforts IPCC creates infrastructure to coordinate experiments between groups Standard emissions scenarios Standard protocols

53
Raupach et al., PNAS, 2007 Climate projections: What is to come?

55
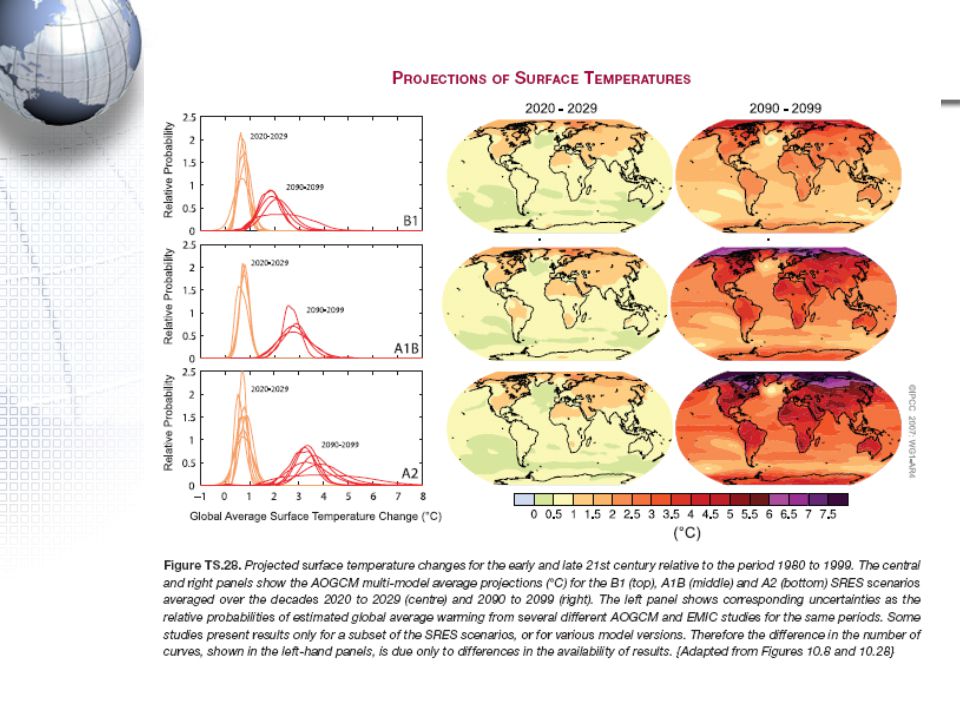
Climate change experiments from 16 groups (11 countries) and 23 models collected at PCMDI (over 31 terabytes of model data) Committed warming averages 0.1°C per decade for the first two decades of the 21 st century; across all scenarios, the average warming is 0.2 ° C per decade for that time period (recent observed trend 0.2°C per decade ) IPCC Ch. 10, Fig. 10.4, TS-32 Anomalies relative to 1980-99 Climate projections: Global Temperature

56
IPCC Report on Anthropogenic Climate Impacts

57
IPCC – Publishing and conveying knowledge

58
Figure 11.12

59
Figure 10.19

60
Figure 10.18

63
QUESTIONS?

64
Climate models can be used to provide information on changes in extreme events such as heat waves Heat wave severity defined as the mean annual 3-day warmest nighttime minima event Model compares favorably with present-day heat wave severity In a future warmer climate, heat waves become more severe in southern and western North America, and in the western European and Mediterranean region Observed Model Future From Meehl and Tebaldi 2005

65
Climate Change Attribution

67
Regional sources of emissions

68
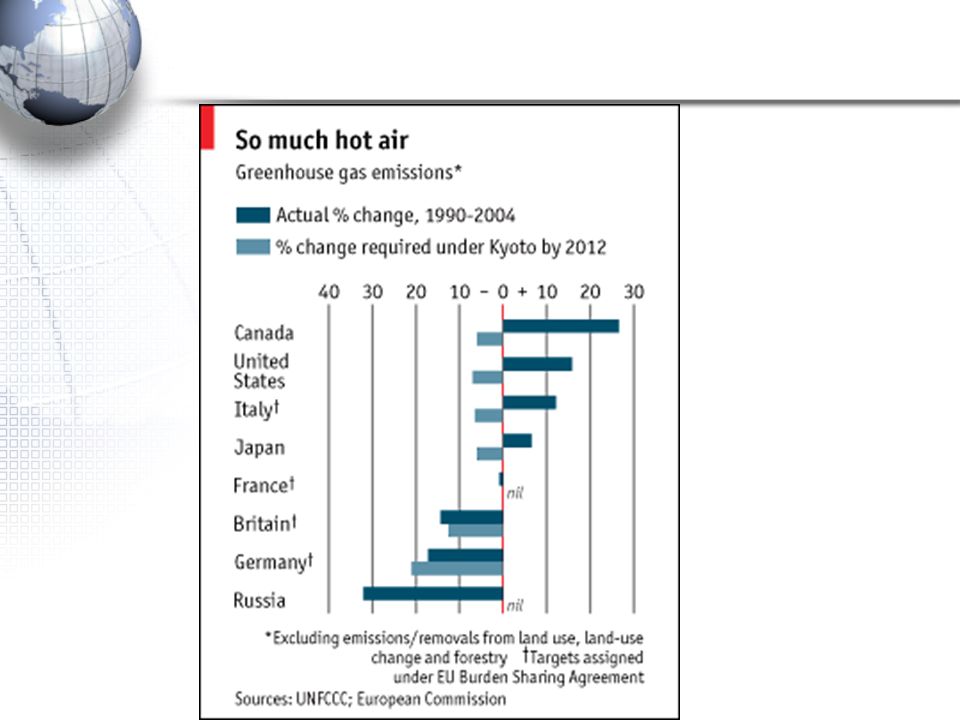
Greenhouse gas sources

70
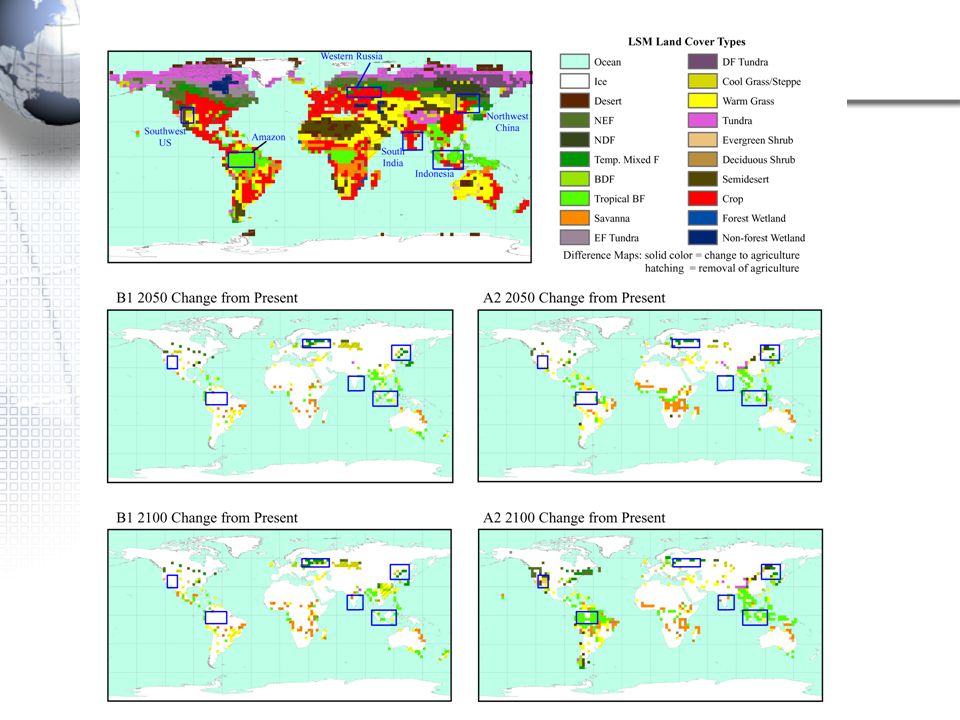
PCM Uncertainty/Historical Equilibrium Land Cover Simulations

71
PRESENT DAY UNCERTAINTY Arctic – albedo Amazon – latent heat flux Australia – albedo HISTORICAL CHANGE Climate difference from land cover classification is as large as the climate difference from land cover change Primarily shift to agriculture

72
Seasonal Change in Albedo Seasonal Change in Net Radiation PCM Present Day Comparison Image - LSM Strong winter/spring albedo change in the Northern Hemisphere translates to spring/summer net radiation change due to solar seasonality

73
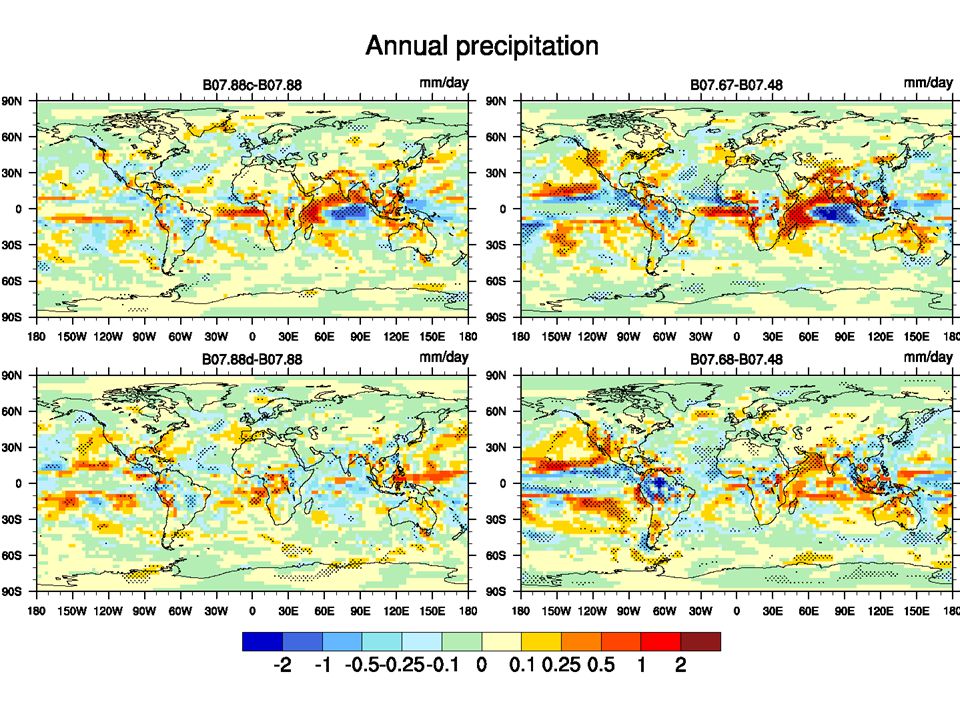
Change in temperature Shading = standard t test 0.95 confidence level Contour = bootstrap 0.95 confidence level Annual PCM Historical Comparison JJA DJF Bootstrap confidence test shows strong summer hemisphere signal in sub-tropics Many of the areas are over land cover change locations

74
Change in minimum daily temperature PCM Historical Comparison IPCC 2001 The scientific Basis: figure 2.2 Diurnal temperature range is shrinking as is observed in many locations Change in maximum daily temperature

79
Future Simulations for Kansas

80
Kansas Climate over the last century

82
Global Climate over the last century

Similar presentations


 Ruby Leung (PNNL) Tom Henderson (MMM/NCAR) Mariana Vertenstein (CGD/NCAR) Gordon.>")


>")


orbit (eccentricity), from ellipse to circle at 100,000 year cycles, b)wobble (precession),>")

 Energy in the Atmosphere San Jose State University, January 24, 2004>")


