Download presentation
Presentation is loading. Please wait.

1
Phylogenetics We had this naming scheme as developed by who? when? Later we realized that this way of classifying (naming) organisms often reflected their true evolutionary relationships..or phylogenies Our goal today is to make a classification system that reflects the organisms' evolutionary history. Problems cropped up due to phenetics…
 organisms often reflected their true evolutionary relationships..or phylogenies. Our goal today is to make a classification system that reflects the organisms evolutionary history. Problems cropped up due to phenetics…")
3
Figure 20.7 Figure 20.7 Convergent evolution of analogous burrowing characteristics 3

4
Why does simple phenetics based on morphology cause confusion?
Synapsids Monotremes Marsupials Dolphins 0.5 m This node represents the common ancestor of dolphins and ichthyosaurs. It is unlikely that it had a streamlined body, long jaws filled with sharp teeth, or fins and flippers because few of its descendants did Primates Dolphins and ichthyosaurs evolved their similar features independently Rodents Dinosaurs Birds Ichthyosaurs 0.5 m Lizards

6
Sorting homologous and analogous traits
Figure 20.2 Sorting homologous and analogous traits No limbs Eastern glass lizard Monitor lizard Iguanas ANCESTRAL LIZARD (with limbs) Snakes Figure 20.2 Convergent evolution of limbless bodies No limbs Geckos
 Snakes. Figure 20.2 Convergent evolution of limbless bodies. No limbs. Geckos.")
7
Convergent characteristics
Synapsids Monotremes Common dolphin Marsupials Dolphins 0.5 m This node represents the common ancestor of dolphins and ichthyosaurs. It is unlikely that it had a streamlined body, long jaws filled with sharp teeth, or fins and flippers because few of its descendants did Primates Dolphins and ichthyosaurs evolved their similar features independently Rodents Dinosaurs Ichthyosaur Birds Ichthyosaurs 0.5 m Lizards Convergent characteristics

8
Are gliding flaps between front and back limbs ….
analogous traits? or homologous traits? Homologous characters=“really shared”=shared due to shared ancestry Analogous characters=look same but really are not the same from an evolutionary standpoint=show homoplasy

9
Campbell.. Adaptation can obscure homologies. Convergence can create misleading analogies.

10
derived traits or characters
To get away from this problem Hennig said we should only gather groups together that share “special traits” that are evolutionarily new or novel derived traits or characters All groups should be monophyletic (includes an ancestor with all descendent species) A clade is… Cladistics! Ucmp berkeley
 A clade is… Cladistics! Ucmp berkeley.")
11
Which boxes (which groups) show clades or monophyletic groups?
 show clades or monophyletic groups")
12
Which boxes (which groups) show clades or monophyletic groups?
 show clades or monophyletic groups")
13
Which boxes (which groups) show clades or monophyletic groups?
Figure 20.10 Which boxes (which groups) show clades or monophyletic groups? (a) Monophyletic group (clade) (b) Paraphyletic group (c) Polyphyletic group A A A 1 1 B Group I B B Group III C C C D D D E E Group II E 2 2 Figure Monophyletic, paraphyletic, and polyphyletic groups F F F G G G 13
 show clades or monophyletic groups (a) Monophyletic group. (clade) (b) Paraphyletic group. (c) Polyphyletic group. A. A. A B. Group I. B. B. Group III. C. C. C. D. D. D. E. E. Group II. E Figure Monophyletic, paraphyletic, and polyphyletic groups. F. F. F. G. G. G. 13.")
14
Do the clip test…what are monophyletic groups here?

18
MM=1460 MN=2550 NN=990 We can calculate the allele frequencies as: Frequency of M = .547=p Frequency of N = .453=q We can now calculate our expected genotype frequencies. How many would we expect to have if “nothing is going on” MM = p2 = (.547) 2 = .299, or 1496 individuals in the sample MN = 2pq = 2 x (.547 x = .496, or 2478 individuals NN = q2 = (.453)2 = .205, or 1026 individuals
 2 = .299, or 1496 individuals in the sample. MN = 2pq = 2 x (.547 x = .496, or 2478 individuals. NN = q2 = (.453)2 = .205, or 1026 individuals.")
19
Making a phylogenetic tree…
Figure 20.11 Making a phylogenetic tree… TAXA Lancelet (outgroup) (outgroup) Lancelet Lamprey Leopard Bass Turtle Lamprey Frog Vertebral column (backbone) 1 1 1 1 1 Bass Vertebral column Hinged jaws 1 1 1 1 Frog Four walking legs Hinged jaws CHARACTERS 1 1 1 Turtle Four walking legs Amnion 1 1 Figure Constructing a phylogenetic tree Amnion Hair 1 Leopard Hair (a) Character table (b) Phylogenetic tree 19
 (outgroup) Lancelet. Lamprey. Leopard. Bass. Turtle. Lamprey. Frog. Vertebral. column. (backbone) Bass. Vertebral. column. Hinged jaws Frog. Four. walking legs. Hinged jaws. CHARACTERS Turtle. Four walking legs. Amnion Figure Constructing a phylogenetic tree. Amnion. Hair. 1. Leopard. Hair. (a) Character table. (b) Phylogenetic tree. 19.")
20
Making a phylogenetic tree…
Figure 20.11 Making a phylogenetic tree… TAXA Lancelet (outgroup) (outgroup) Lancelet Lamprey Leopard Bass Lamprey Frog Turtle Vertebral column (backbone) 1 1 1 1 1 Bass Vertebral column Hinged jaws 1 1 1 1 Frog Four walking legs Hinged jaws CHARACTERS 1 1 1 Turtle Four walking legs Amnion 1 1 Figure Constructing a phylogenetic tree Amnion Hair 1 Leopard Hair (a) Character table (b) Phylogenetic tree “principle of parsimony” assume the fewest number of evolutionary changes or events-simplest explanation given data 20
 (outgroup) Lancelet. Lamprey. Leopard. Bass. Lamprey. Frog. Turtle. Vertebral. column. (backbone) Bass. Vertebral. column. Hinged jaws Frog. Four. walking legs. Hinged jaws. CHARACTERS Turtle. Four walking legs. Amnion Figure Constructing a phylogenetic tree. Amnion. Hair. 1. Leopard. Hair. (a) Character table. (b) Phylogenetic tree. principle of parsimony assume the fewest number of evolutionary changes or events-simplest explanation given data. 20.")
21
Making a tree using cladistic analysis
Pull out derived characters or synapomorphies in a table! Then use an outgroup to figure out what your starting point-what your ancestral state is. Use principle of parsimony-assumes the fewest number of evolutionary changes or events-simplest explanation given data

22
Different tree!

23
://

24
Most parsimonious-but wrong!
Figure 27-4 The astragalus is a synapomorphy that identifies artiodactyls as a monophyletic group. Artiodactyls Whale Camel Peccary Pig Hippo Deer Cow Most parsimonious-but wrong! Astragalus (ankle bone) Gain of pulley- shaped astragalus If whales are related to hippos, then two changes occurred in the astragalus. Natural selection can obscure homologies..! Artiodactyls Camel Peccary Pig Hippo Whale Deer Cow Loss of pulley- shaped astragalus Less parsimonious but right! Gain of pulley- shaped astragalus Data on the presence and absence of SINE genes support the close relationship between whales and hippos. 1 = gene present 0 = gene absent ? = still undetermined Whales and hippos share four unique SINE genes (4, 5, 6, and 7)
 Gain of pulley- shaped astragalus. If whales are related to hippos, then two changes occurred in the astragalus. Natural selection can obscure homologies..! Artiodactyls. Camel. Peccary. Pig. Hippo. Whale. Deer. Cow. Loss of pulley- shaped astragalus. Less parsimonious but right! Gain of pulley- shaped astragalus. Data on the presence and absence of SINE genes support the close relationship between whales and hippos. 1 = gene present. 0 = gene absent. = still undetermined. Whales and hippos share four. unique SINE genes (4, 5, 6, and 7)")
25
Most parsimonious-but wrong!
Figure 27-4 The astragalus is a synapomorphy that identifies artiodactyls as a monophyletic group. Artiodactyls Whale Camel Peccary Pig Hippo Deer Cow Most parsimonious-but wrong! Astragalus (ankle bone) Gain of pulley- shaped astragalus If whales are related to hippos, then two changes occurred in the astragalus. Natural selection can obscure homologies..! Artiodactyls Camel Peccary Pig Hippo Whale Deer Cow Loss of pulley- shaped astragalus Less parsimonious but right! Gain of pulley- shaped astragalus Data on the presence and absence of SINE genes support the close relationship between whales and hippos. 1 = gene present 0 = gene absent ? = still undetermined Whales and hippos share four unique SINE genes (4, 5, 6, and 7)
 Gain of pulley- shaped astragalus. If whales are related to hippos, then two changes occurred in the astragalus. Natural selection can obscure homologies..! Artiodactyls. Camel. Peccary. Pig. Hippo. Whale. Deer. Cow. Loss of pulley- shaped astragalus. Less parsimonious but right! Gain of pulley- shaped astragalus. Data on the presence and absence of SINE genes support the close relationship between whales and hippos. 1 = gene present. 0 = gene absent. = still undetermined. Whales and hippos share four. unique SINE genes (4, 5, 6, and 7)")
26
Most parsimonious-but wrong!
Figure 27-4 The astragalus is a synapomorphy that identifies artiodactyls as a monophyletic group. Artiodactyls Whale Camel Peccary Pig Hippo Deer Cow Most parsimonious-but wrong! Astragalus (ankle bone) Gain of pulley- shaped astragalus If whales are related to hippos, then two changes occurred in the astragalus. Natural selection can obscure homologies..! Artiodactyls Camel Peccary Pig Hippo Whale Deer Cow Loss of pulley- shaped astragalus Less parsimonious but right! Gain of pulley- shaped astragalus Data on the presence and absence of SINE genes support the close relationship between whales and hippos. 1 = gene present 0 = gene absent ? = still undetermined Whales and hippos share four unique SINE genes (4, 5, 6, and 7)
 Gain of pulley- shaped astragalus. If whales are related to hippos, then two changes occurred in the astragalus. Natural selection can obscure homologies..! Artiodactyls. Camel. Peccary. Pig. Hippo. Whale. Deer. Cow. Loss of pulley- shaped astragalus. Less parsimonious but right! Gain of pulley- shaped astragalus. Data on the presence and absence of SINE genes support the close relationship between whales and hippos. 1 = gene present. 0 = gene absent. = still undetermined. Whales and hippos share four. unique SINE genes (4, 5, 6, and 7)")
27
Most parsimonious-but wrong!
Figure 27-4 The astragalus is a synapomorphy that identifies artiodactyls as a monophyletic group. Artiodactyls TAXA Lancelet (outgroup) Whale Camel Peccary Pig Hippo Deer Cow (outgroup) Lancelet Most parsimonious-but wrong! Lamprey Leopard Bass Frog Turtle Lamprey Vertebral column (backbone) Astragalus (ankle bone) Gain of pulley- shaped astragalus 1 1 1 1 1 Bass Vertebral column If whales are related to hippos, then two changes occurred in the astragalus. Natural selection can obscure homologies..! Hinged jaws 1 1 1 1 Artiodactyls Frog Four walking legs Hinged jaws CHARACTERS 1 1 1 Turtle Amnion Camel Peccary Pig 1 Hippo Four walking legs 1 Whale Deer Cow Loss of pulley- shaped astragalus Amnion Hair 1 Less parsimonious but right! Leopard Hair (a) Character table Gain of pulley- shaped astragalus (b) Phylogenetic tree Data on the presence and absence of SINE genes support the close relationship between whales and hippos. 1 = gene present 0 = gene absent ? = still undetermined Whales and hippos share four unique SINE genes (4, 5, 6, and 7)
 Whale. Camel. Peccary. Pig. Hippo. Deer. Cow. (outgroup) Lancelet. Most parsimonious-but wrong! Lamprey. Leopard. Bass. Frog. Turtle. Lamprey. Vertebral. column. (backbone) Astragalus. (ankle bone) Gain of pulley- shaped astragalus Bass. Vertebral. column. If whales are related to hippos, then two changes occurred in the astragalus. Natural selection can obscure homologies..! Hinged jaws Artiodactyls. Frog. Four. walking legs. Hinged jaws. CHARACTERS Turtle. Amnion. Camel. Peccary. Pig. 1. Hippo. Four walking legs. 1. Whale. Deer. Cow. Loss of pulley- shaped astragalus. Amnion. Hair. 1. Less parsimonious but right! Leopard. Hair. (a) Character table. Gain of pulley- shaped astragalus. (b) Phylogenetic tree. Data on the presence and absence of SINE genes support the close relationship between whales and hippos. 1 = gene present. 0 = gene absent. = still undetermined. Whales and hippos share four. unique SINE genes (4, 5, 6, and 7)")
28
Molecular data was used to inform the situation and led us to the likely correct tree!

29
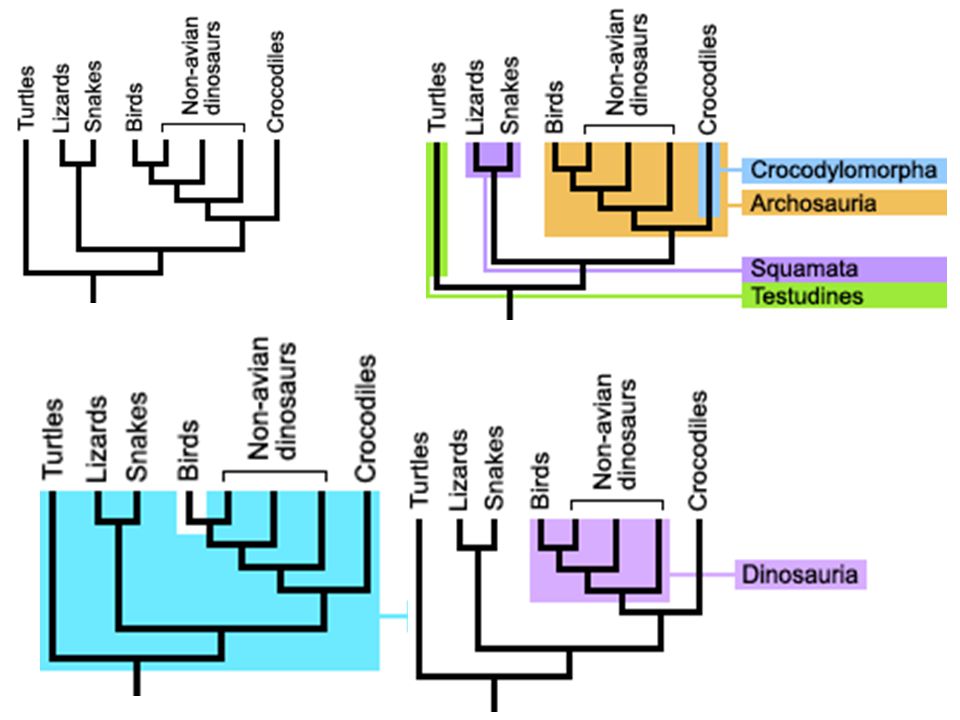
What can you not assume given a tree that looks like this??
Will those close to each other always look phenotypically or morphologically similar? Why or Why not? Figure 20.15 Lizards and snakes Crocodilians Ornithischian dinosaurs Common ancestor of crocodilians, dinosaurs, and birds Saurischian dinosaurs Birds

30
What can you not assume given a tree that looks like this??
Will those close to each other always look phenotypically similar? Figure 20.15 Lizards and snakes Crocodilians Ornithischian dinosaurs Common ancestor of crocodilians, dinosaurs, and birds Saurischian dinosaurs Birds

31
Only conveys branching pattern, order. Rotate at nodes. Order Family
Figure 20.4 Order Family Genus Species Only conveys branching pattern, order. Rotate at nodes. Felidae Panthera pardus (leopard) Panthera Taxidea taxus (American badger) Taxidea Carnivora Mustelidae Lutra lutra (European otter) Lutra 1 Canis latrans (coyote) Canidae Canis 2 Canis lupus (gray wolf)
 Panthera. Taxidea. taxus. (American. badger) Taxidea. Carnivora. Mustelidae. Lutra lutra. (European. otter) Lutra. 1. Canis. latrans. (coyote) Canidae. Canis. 2. Canis. lupus. (gray wolf)")
32
Why does this tree look different than the previous trees?
IS looking at RATE of change of homologous genes. Branch lengths are proportional to genetic change. Since all are around today…what does the fact that there are different branch lengths mean?? Figure 20.12 Drosophila Lancelet Zebrafish Figure Branch lengths can represent genetic change Frog Chicken Human Mouse 32

33
15 units long 12 units 1.2 units 6.5 units Drosophila Lancelet
Figure 20.12 15 units long Drosophila 12 units 1.2 units Lancelet Zebrafish 6.5 units Figure Branch lengths can represent genetic change Frog Chicken Human Mouse 33

34
Figure 20.13 We can anchor those nodes at specific dates based on the fossil record! Drosophila Lancelet Zebrafish Frog Chicken Human Figure Branch lengths can indicate time Mouse PALEOZOIC MESOZOIC CENOZOIC 542 251 65.5 Present Millions of years ago 34

35
Then we can divide length measured in previous tree by time
Then we can divide length measured in previous tree by time (12 units/540my) Figure 20.13 Drosophila Lancelet Zebrafish Frog Figure Branch lengths can indicate time Chicken Human Mouse PALEOZOIC MESOZOIC CENOZOIC 542 251 65.5 Present Millions of years ago 35
 Figure Drosophila. Lancelet. Zebrafish. Frog. Figure Branch lengths can indicate time. Chicken. Human. Mouse. PALEOZOIC. MESOZOIC. CENOZOIC Present. Millions of years ago. 35.")
36
Number of accumulated mutations in 7 proteins in mammals
Figure 20.18 Number of accumulated mutations in 7 proteins in mammals 90 60 Number of mutations 30 Figure A molecular clock for mammals 30 60 90 120 Divergence time (millions of years) 36
 36.")
37
When is a molecular clock not consistent!
Selection pressure on certain proteins might mess things up…why? DNA that codes for ribosomal RNA (rRNA) evolves slowly so use to look at divergence that might have taken place 100s of millions of years ago.. DNA in mitochondria (mtDNA) evolves rapidly and can be used to explore rapid evolutionary events like differences within a species- You would end up with a really BAD tree if you tried to use mtDNA to look at deep divisions within mammals for example.
 evolves slowly so use to look at divergence that might have taken place 100s of millions of years ago.. DNA in mitochondria (mtDNA) evolves rapidly and can be used to explore rapid evolutionary events like differences within a species- You would end up with a really BAD tree if you tried to use mtDNA to look at deep divisions within mammals for example.")
38
Beyond fossil record we often get into trouble ..
Can get around by using many different regions and if all give same tree then probably correct.

39
How do we use phylogenetic trees? Your text…
Figure 20.15 How do we use phylogenetic trees? Your text… How do they make predictions about behavior of extinct dinos Lizards and snakes Crocodilians Ornithischian dinosaurs Common ancestor of crocodilians, dinosaurs, and birds Saurischian dinosaurs Figure A phylogenetic tree of birds and their close relatives Birds 39

40
But where did this mystery virus come from?
SARS virus 2002 and 2003 But where did this mystery virus come from? Airborne germ caused 774 deaths and more than 8000 cases of illness. Scientists immediately suspected that it had jumped to humans from some other organism. In May of 2003, attention focused in on cat-like mammals called civets. Infected civets were discovered at a live animal market in southern China (where they are occasionally eaten). However, since further searches failed to turn up more tainted civets, scientists concluded that they were not the original source of SARS and continued their quest. Then in the fall of 2005, two teams of researchers independently discovered large reservoirs of a SARS-like virus in Chinese horseshoe bats. Based on this evidence, biologists have come up with a plausible path of transmission: infected bats and uninfected civets came into contact at a market, the virus was transmitted to civets and then multiplied and evolved in civets (or other animals) in the public market, until eventually the virus hopped to humans.
. However, since further searches failed to turn up more tainted civets, scientists concluded that they were not the original source of SARS and continued their quest. Then in the fall of 2005, two teams of researchers independently discovered large reservoirs of a SARS-like virus in Chinese horseshoe bats. Based on this evidence, biologists have come up with a plausible path of transmission: infected bats and uninfected civets came into contact at a market, the virus was transmitted to civets and then multiplied and evolved in civets (or other animals) in the public market, until eventually the virus hopped to humans.")
41
Index of base changes between
Figure 20.19 How do they use molecular clocks to establish origination dates of HIV virus? 0.15 HIV Index of base changes between HIV gene sequences 0.10 Range Adjusted best-fit line (accounts for uncertain dates of HIV sequences 0.05 Figure Dating the origin of HIV-1 1900 1920 1940 1960 1980 2000 Year 41

Similar presentations


>")


