Download presentation
Presentation is loading. Please wait.

1
Which tree species and biome types are most vulnerable to climate change in the US Northern Rocky Mountains? Andy Hansen and Linda Phillips Ecology Department Montana State University NASA Applied Sciences Program (NNH10ZDA001N - BIOCLIM)
.")
2
Goal Synthesize published studies to assess potential impact of climate change on biome types and tree species in the GNLCC and in the Greater Yellowstone and Glacier ecosystems. Great Northern LCC Protected area centered Ecosystems

3
Components of Vulnerability Exposure Vulnerability Sensitivity Potential Impact Adaptive Capacity

4
Components of Vulnerability Exposure Vulnerability Sensitivity Potential Impact Adaptive Capacity Climate change Species climate tolerances Projected climate suitability

5
Climate Envelop Modeling Presence 1950-1980 = f(climate) WBP Presence 1950-1980 Climate 1950-1980 Climate 2100 = Prob of Presence 2100 Probability of Presence 2100 Projected Climate 2100
 WBP Presence Climate Climate 2100 = Prob of Presence 2100 Probability of Presence 2100 Projected Climate 2100")
6
Climate Envelop Modeling Utility Climate suitability is a strong indicator of where viable populations may be able to exist. Other controlling factors can be manipulated through management. Thus, knowledge of climate suitability is a critical first filter for deciding where apply management. Ignores Soils Disturbance Pests Competition with other species Adaptive capacity: dispersal, genetic variation, etc. Identifies the places projected to have suitable climate for presence of the species in the future.

7
Studies Synthesized StudyStatistical modeling method Reference and future projection periods Scenarios / GCMsVegetation units Rehfeldt et al. 2012 Random Forests1961-1990 2030, 2060, 2090 A1, B2 / Consensus of CGCM3, GFDLCM21, HADCM3 Biomes Crookson et al. 2010 Random Forests1961-1990 2030, 2060, 2090 A1, B2 / CGCM3, GFDLCM21, HADCM3 Tree species Coops and Waring 2011 Decision Tree Regression 1950-1975 2020’s, 2050’s, 2080’s A1, B2 / CGCM3 Tree species Gray & Hamann 2013 Random Forests1961-1990 2020s, 2050s, 2080s Consensus of AIFI, A2, B1, B2 under CGCM, CSIRO2, HADCM3, ECHAM4, PCM Tree species Bell et al. 2014Baysian Logistic Regression 1981-2010 2070-2099 A1, B2 / Average of 16 GCMs Tree species Selected based on: GNLCC or wider in extent; used comparable GCMs, scenarios, methods; grain size projection results available.

8
Future Climate Projection: Scenarios IPCC Third/Fourth Assessment Report (2001, 2007) A2 and B1 separately: Crookston et al. Coops & Waring Bell et al. A2 and B1 concensus: Rehfeldt et al. Gray & Hamann A2: “Business as usual emissions” B1: “Global reductions in emissions”

9
Future Climate Projection IPCC Third/Fourth Assessment Report (2001, 2007) IPCC Fifth Assessment Report (2013)
 IPCC Fifth Assessment Report (2013)")
10
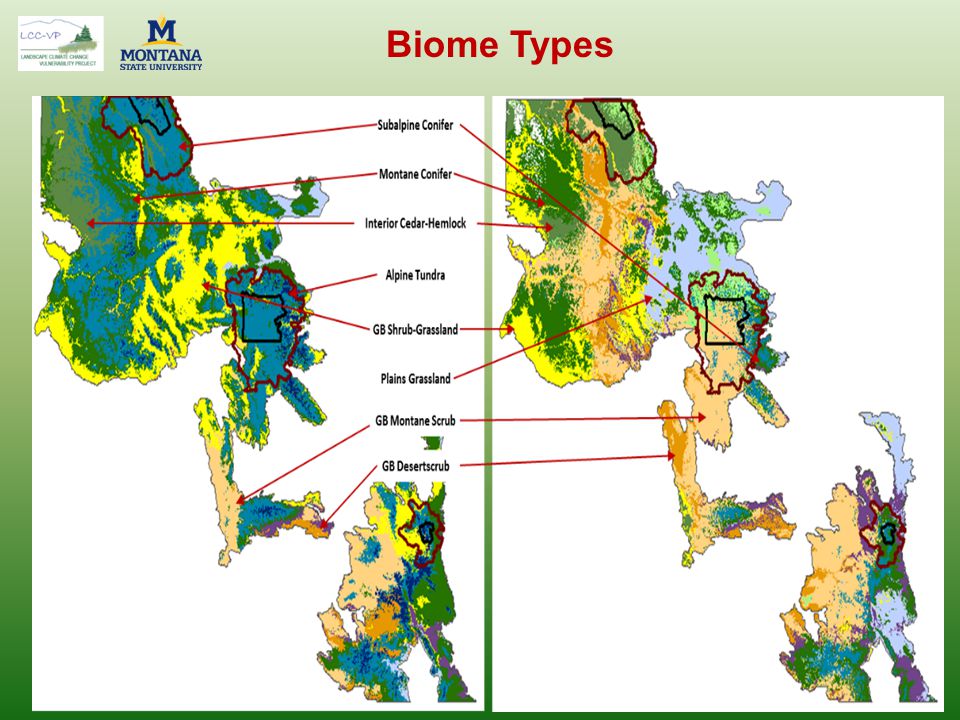
Biome Types

12
Tree Species Subalpine Montane Mesic Western hemlock Western redcedar Crookston et al.Coops & WaringGray & HamannBell et al. Percent of GNLCC Suitable in Climate, Reference Period to 2100 A2 Scenario

13
Change in Spatial Patterns A2 Scenario

14
Change in Spatial Patterns

15
A2 Scenario Change in Spatial Patterns

16
Species expansions of Coops & Waring suspect because they used a GCM subsequently found to project cooler and wetter conditions in the Pacific Northwest than a 20 GCM ensemble average (Mote et al. 2005, 2008). A2 Scenario Change in Spatial Patterns
. A2 Scenario Change in Spatial Patterns.")
17
Vulnerability Assessment Based on Potential Impact Time PeriodMetricUnitsVulnerability Ranking Current Period Area of suitable habitatPercent of study area5: Very high (<10% of area) 4: High (10<30% of area) 3: Medium (30<50% of area) 2: Low (50<75% of area) 1: Very low (>=75% of area) Late century (e.g., 2070- 2090) Loss of reference-period suitable habitat Percent loss of area from the reference period 5: Very high (>75%) 4: High (>50-75%) 3: Medium (>30-50%) 2: Low (>10-30%) 1: Very low (<=10%) Naturally colonizable newly suitable habitat by 2070-2090 % gain in suitable habitat <=30 km from ref suitable) 0: very low gain (0<10%) -1: low gain (10<50%) -2: mod gain (50<100%) -3: large gain (100<150%) -4: very large gain (>=150%) Newly suitable habitat by 2070-2090 requiring assisted migration Percent gain in suitable habitat >30 km from ref suitable) 0: low gain (0<20%) -1: mod gain (20<100%) -2: large gain (>100%) A2 Scenario
 4: High (10<30% of area) 3: Medium (30<50% of area) 2: Low (50<75% of area) 1: Very low (>=75% of area) Late century (e.g., ) Loss of reference-period suitable habitat Percent loss of area from the reference period 5: Very high (>75%) 4: High (>50-75%) 3: Medium (>30-50%) 2: Low (>10-30%) 1: Very low (<=10%) Naturally colonizable newly suitable habitat by % gain in suitable habitat <=30 km from ref suitable) 0: very low gain (0<10%) -1: low gain (10<50%) -2: mod gain (50<100%) -3: large gain (100<150%) -4: very large gain (>=150%) Newly suitable habitat by requiring assisted migration Percent gain in suitable habitat >30 km from ref suitable) 0: low gain (0<20%) -1: mod gain (20<100%) -2: large gain (>100%) A2 Scenario")
18
Climate Suitability as a Component of VA Climate-envelop modeling is one component of the needed assessment methods. Dawson et al. 2011 Utility Climate suitability is a strong indicator of where viable populations may be able to exist. Knowledge of climate suitability is a critical filter for deciding where apply management.

19
Questions for WBP Climate Suitable Area Ecosystem services provided by WBP are likely to be reduced. But, will WBP maintain viable populations? Might micro-refugia provide adequate climate space to allow viable populations to persist? Do genetic variants exist that are better able to tolerate more extreme climate conditions? How did WBP persist through warmer periods during the Holocene? Is mountain pine beetle ever known to cause local extinction of host species? Can WBP be viable under warmer and drier conditions if competing vegetation is controlled?

20
Opportunities for Management Distribution of suitable climates among land allocation types. Ref. period 2080’s Crookston et al. / A2

21
Opportunities for Management Adaptation Strategy Land Allocation Type PrivatePrivate protected and nonfederal public Federal multiple use Defacto roadless and wilderness National park Designated wilderness and roadless Monitoring and research XXXXXX PlanningXXXXXX Vulnerability assessment XXXXXX Passive management XXXXXX Active management XXX Which adaptation strategies are legal and/or appropriate in each land allocation type?

22
Conclusions Areal extent of suitable climate for WBP and other subalpine species is likely to be greatly reduced, with reductions in the ecosystem services they provide. Research is needed on WBP population viability. The vulnerability of Mountain hemlock in the GNLCC is poorly known. Resource managers will better understand these changes and be able achieve natural resource objectives if they begin investing in some or all of the adaptation strategies.

23
Acknowledgements NASA Applied Sciences Program (Grant 10-BIOCLIM10-0034) NSF EPSCoR Track-I EPS-1101342 (INSTEP 3) NASA Land Cover Land Use Change Program North Central Climate Sciences Center Federal agency collaborators
 NSF EPSCoR Track-I EPS (INSTEP 3) NASA Land Cover Land Use Change Program North Central Climate Sciences Center Federal agency collaborators")
Similar presentations


 Project is funded by the Climate Change Action Fund and provides climate change scenarios and related information.>")


, University of Cape Town.>")