Download presentation
Presentation is loading. Please wait.

1
Everything you ever wanted to know about using URS Cenk Erdil, HMIS Manager Caitlin Madevu-Matson, SI Specialist Strategic Information Unit 22 May 2014

2
Rationale You may recall past URS webinars – April 2012 – February 2013 We are back by popular demand! – Your responses to the SI webinar survey in Nov 2013 This webinar will be especially useful to – clinical and programmatic staff who do not routinely use URS, but would like to use the data to answer a variety of questions URS is a valuable resource for ALL ICAP teams

3
Objectives Provide a URS refresher on general data use – Basics – Dashboard – Reports Module Answer your questions – A compiled list based on a recent survey

4
Background Web-based, Scalable & Flexible Globally accessible: – http://urs2.icap.columbia.edu http://urs2.icap.columbia.edu ICAP’s central data repository Mainly used for two reasons: – Submit data for routine indicators – General data use

5
Background URS general data use: – Up-to-date ICAP required indicator statistics – Monitoring progress to targets Data reported to ICAP-NY, including: – Mostly ICAP-required indicators – Some indicators that are not ICAP-required

6
Login to URS A A B B C C http://urs2.icap.columbia.edu

7
Forgot Password

8
Login to URS A A B B C C http://urs2.icap.columbia.edu

9
Register for an Account

10
Report a Bug / Issue

12
Overall Structure of URS

14
Dashboard - Definition

15
Dashboard - Tabs

16
Dashboard – Program Areas

17
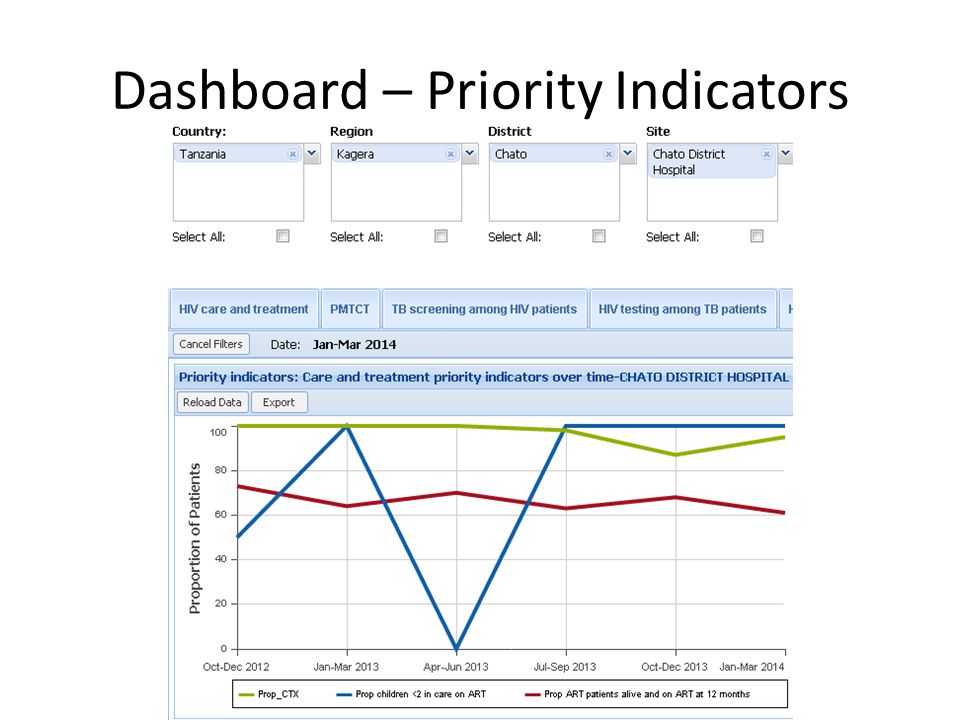
Dashboard – Priority Indicators

18
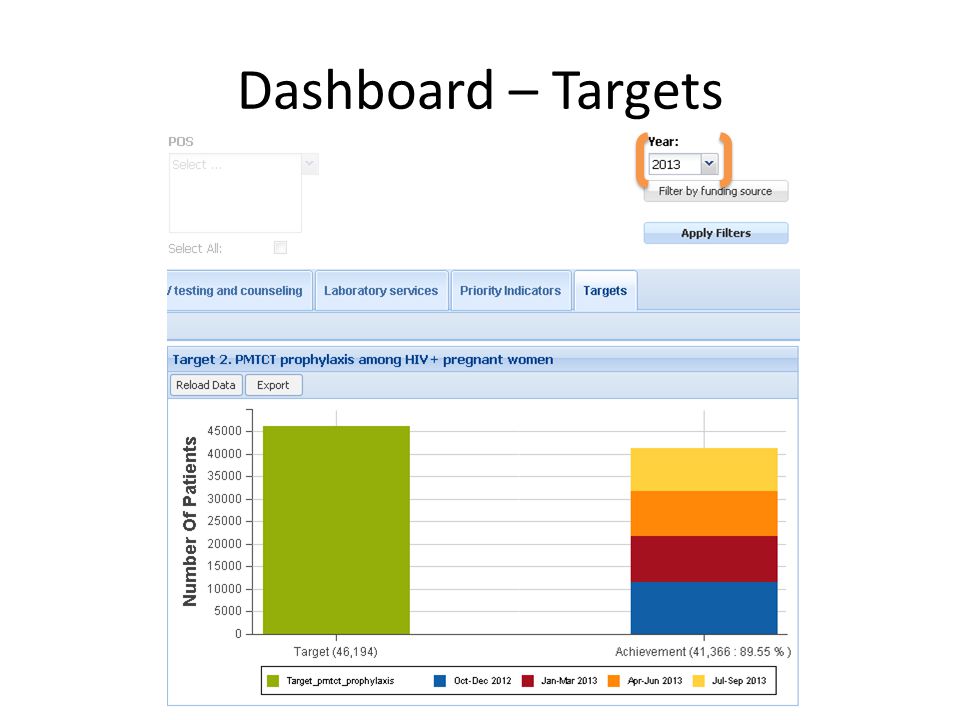
Dashboard - Targets

19
Dashboard – Graphs and Tables A A

20
A A B B

22
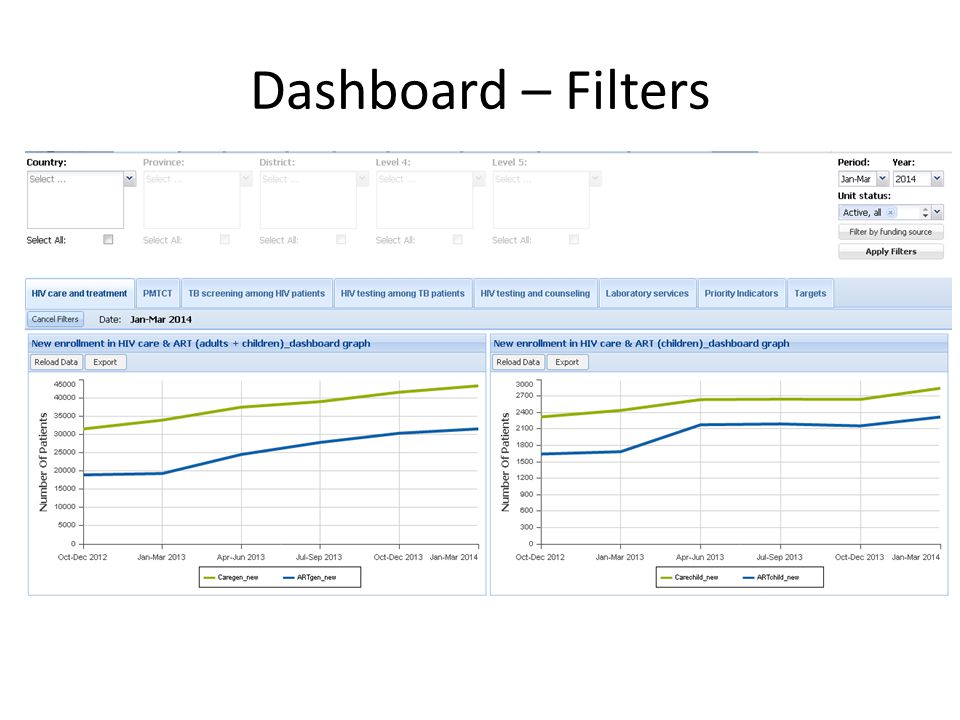
Dashboard – Filters

25
A A

26
A A B B

27
A A C C B B

28
C C D D A A B B

29
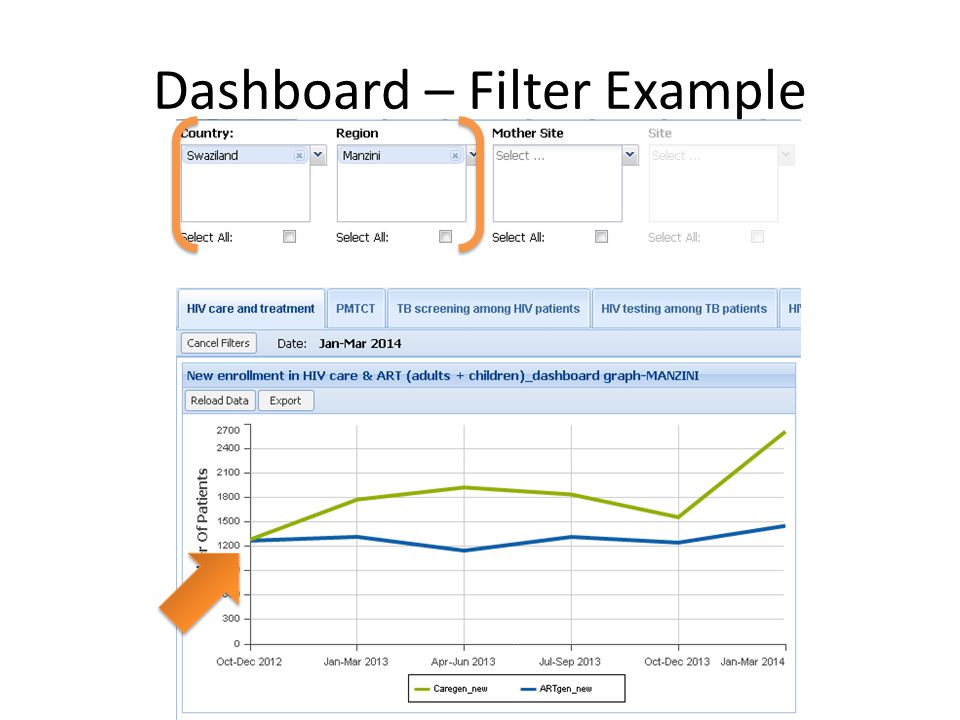
Dashboard – Filter Example

33
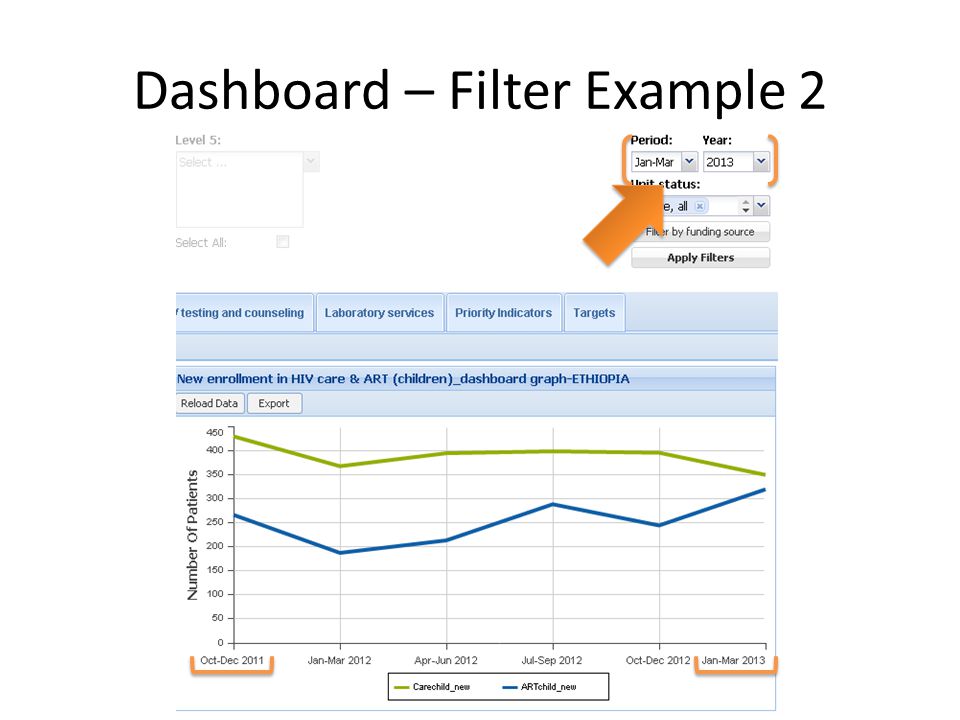
Dashboard – Filter Example 2

35
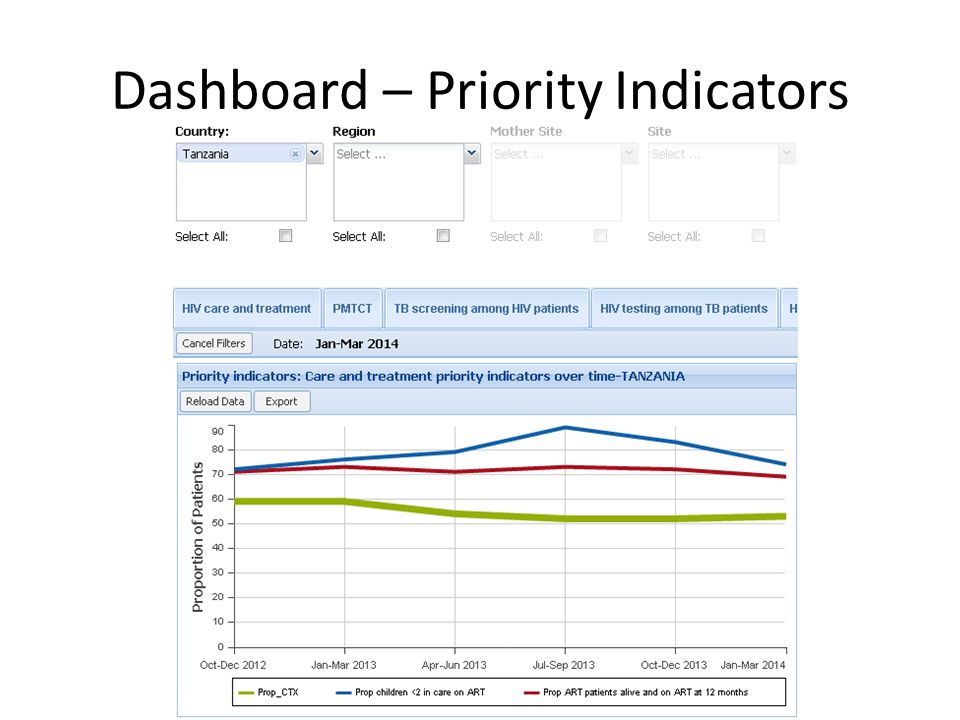
Dashboard – Priority Indicators

39
Dashboard – Targets

41
Reports Reports: provide users the ability to adapt how data are presented – Query: user-defined questions – Constructed indicator: user-defined calculated indicators that use formulas 2 2 1 1

42
Reports – New Query Variables 2 2 1 1 3 3 4 4 Funding source: can select all, or subset Program area: can select all, or subset Time period: Quarter and year Indicators: Add or unselect - will be limited by what program areas are selected in #2

43
Reports – Add Indicators 3 3 2 2 1 1

44
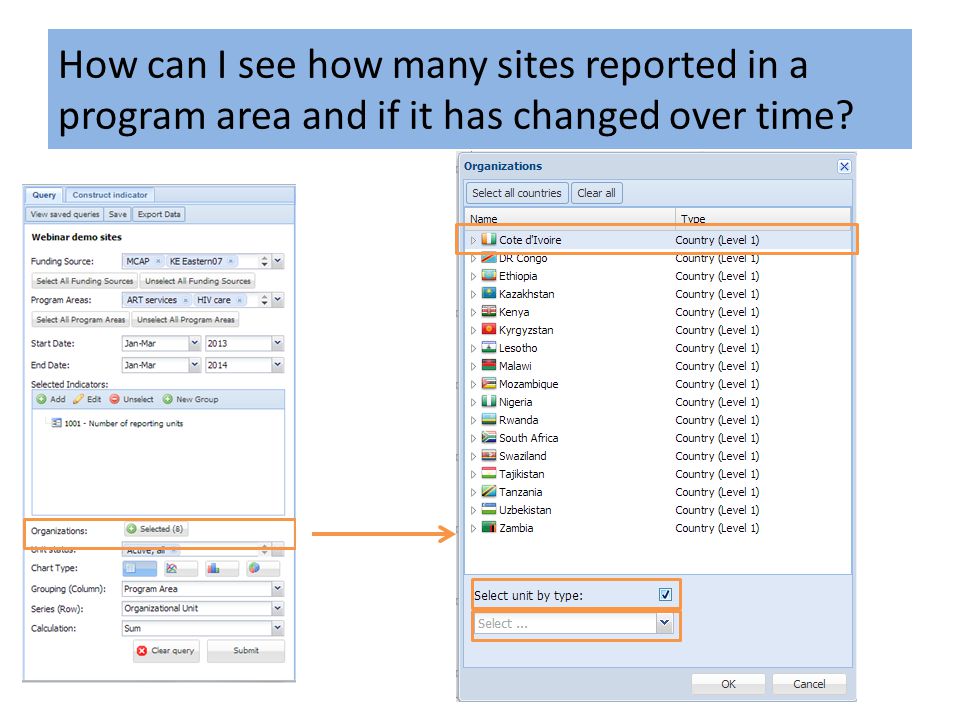
Reports – New Query Variables 2 2 1 1 3 3 4 4 5 5 Funding source: can select all, or subset Program area: can select all, or subset Time period: Quarter and year Indicators: Add or unselect - will be limited by what program areas are selected in #2 Organizations

45
Reports – Organizations Selection

46
Reports – New Query Variables 2 2 1 1 3 3 4 4 5 5 Funding source: can select all, or subset Program area: can select all, or subset Time period: Quarter and year Indicators: Add or unselect - will be limited by what program areas are selected in #2 Organizations

47
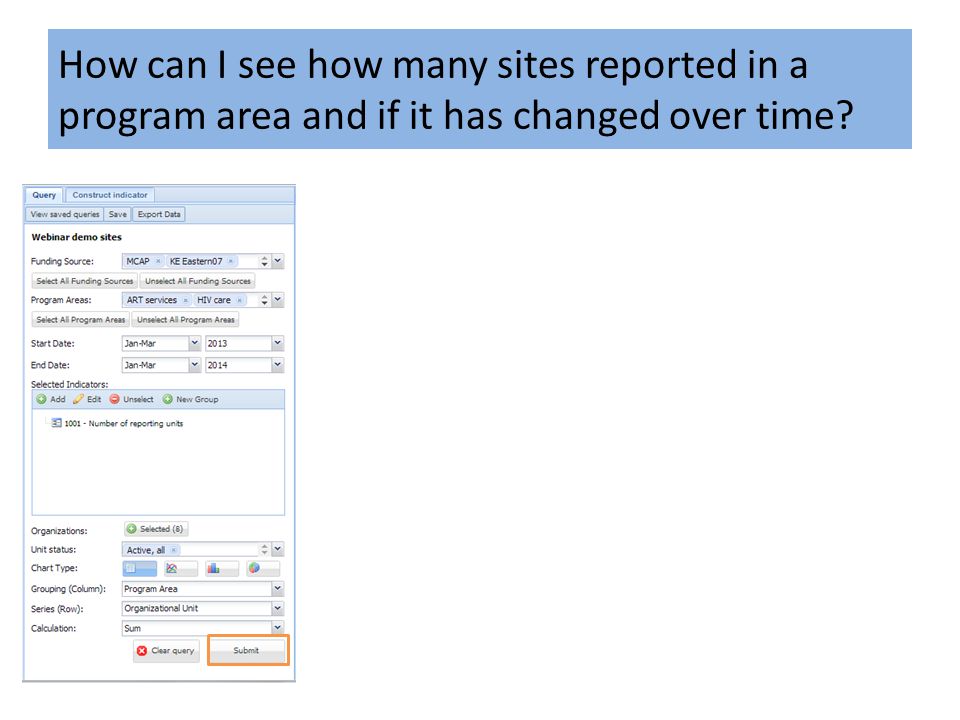
Reports – New Query Options 1 1 2 2 3 3 4 4 Unit status: default is Active, all Chart type: table or graph - Bar graph can be stacked Grouping and series - How to show variables Calculation: default is sum 5 5 Overall: option to have totals

48
Reports – Saved Queries 1 1

49
2 2 3 3 4 4 1 1

50
Your Questions!

51
How can I see progress to targets? Dashboard Use saved query

52
How can I see progress to targets?

54
How can I adapt a saved query? Changing variables – Time period changes – Indicator changes – Organizational unit changes Changing options how data are presented – Chart type changes – Grouping or series changes, e.g. in columns/y axis and rows – Beware, there are 5 types of variables but only 2 can vary in one table query- the others have to remain constant or will be combined

55
How can I track the number of patients on second line regimens?

56
Column : Organizational Unit / Row : Data

57
How can I track the number of patients on second line regimens?

58
Column : Time Period / Row : Data

59
How can I track the number of patients on second line regimens? Column : Time Period / Row : Organizational Unit

60
How can I track the number of patients on second line regimens?

61
Column : Time Period / Row : Organizational Unit

62
How can I track the number of patients on second line regimens? X-axis : Organizational Unit / Series : Data

63
How can I track the number of patients on second line regimens? X-axis : Time Period / Series : Organizational Unit

64
How can I see how many sites reported in a program area and if it has changed over time?

68
Column : Program area / Row : Organizational Unit by Region

69
How can I see how many sites reported in a program area and if it has changed over time? Column : Time period (Q) / Row : Organizational Unit by Region
 / Row : Organizational Unit by Region.")
70
How can I see how many sites reported in a program area and if it has changed over time? Column : Time period (Q) / Row : Program Area
 / Row : Program Area.")
71
How can I see how many sites reported in a program area and if it has changed over time?

72
Where do I go on URS to see what analyses have already been done? (not on URS…) Master Slides – Contain standard graphs and information for all program areas for all countries supported by ICAP for anyone to use – Generated every 6 months : June and December – Available on Data Dissemination Wiki, under Slides – http://icapdatadissemination.wikischolars.columbia.edu/ http://icapdatadissemination.wikischolars.columbia.edu/ – NOTE: need to be invited to join, send your M&E Director or SI Specialist an email for access! (on URS) Dashboards and Saved Queries
 Master Slides – Contain standard graphs and information for all program areas for all countries supported by ICAP for anyone to use – Generated every 6 months : June and December – Available on Data Dissemination Wiki, under Slides – – NOTE: need to be invited to join, send your M&E Director or SI Specialist an for access. (on URS) Dashboards and Saved Queries.")
73
Where do I go (on URS) to see what analyses have already been done?
 to see what analyses have already been done")
74
A GE AND SEX DISTRIBUTION OF PATIENTS ENROLLED IN CARE, BY COUNTRY, AS OF S EPTEMBER 30, 2013 Percent of patients Source: ICAP URS November 2013 Notes: Data are only from clinics currently supported and reporting.

75
Is there a cheat sheet to understand how and where to pull data on the URS? Yes! A few useful resources are available: – URS User manual – This presentation

76
Is there a cheat sheet for indicators on the URS? Reported versus Calculated indicators Yes! A few useful resources are available: – Reporting SOP : describes how reporting at ICAP works – Import instructions : guide of reported indicators that should be imported by program area – Constructed indicators : list of calculated indicators that are already programmed in URS

77
Where are the indicator cheat sheet resources? At any time you are logged in, ICAP M&E Resources is top right Drop down menu with the latest version available for download: – Reporting SOP – Instructions for Import – Constructed Indicators Constructed Indicators May 2014

78
How do I use the Import Instructions? Excel document organized with one program area per tab Headings on each tab are the same Unique ID to identify indicators Long description of what is reported Optional: if sub- categories exist Required by ICAP? 1= yes 0= no

79
How do I use the Constructed Indicators Guide? Similar to Import Instructions, all on one tab Includes Formulas Unique ID to identify indicators Long description of what is reported Formula used in calculation (URS ID)
.")
80
Can I get information about viral loads or those suspected of treatment failure on URS? No. Neither viral load nor suspected treatment failure are in the URS aggregate data – Not ICAP required indicators – Information about suspected treatment failure using CD4 analysis is available in Patient Level Reports (Standard of Care report) that you can download from URS M&E Resources.
 that you can download from URS M&E Resources..")
81
How can I tell if data are still coming in or are finalized for a quarter? URS is a live system SI Unit Director sends out Reporting Milestones each quarter that states when data should be finalized Usually 1 month after the end of a quarter, you can assume it is final: but it is always best to reach out to your M&E director or SI Specialist to be sure and if you have additional questions

82
If targets are not available initially do you go back and enter them when available? Yes! SI Specialists and country M&E teams are responsible for entering targets If you don’t see targets, please reach out to your M&E staff or the SI Specialist

83
Summary URS2 is widely available for making use of routinely collected program data Dashboards are pre-set graphs and tables for quick reference Easily create your own reports to view the data you want in tables or graphs Resources on how to use URS2 are accessible – E.g. URS User manual, the Reporting SOP and Indicator guides SI Unit and M&E Directors are also available

84
Thanks! Let us know if you have any questions: Caitlin – cm3315@columbia.edu Cenk – dce2110@columbia.educm3315@columbia.edudce2110@columbia.edu

Similar presentations


. MODULE 4.5 PubMed/How to Use MY NCBI Instructions - This part of the: course is a PowerPoint demonstration intended to introduce.>")


>")


, For Youth Initiative.>")


 Library Dashboards Circulation Analysis Collection Analysis.>")
. MODULE 4.5 PubMed/How to Use MY NCBI Instructions - This part of the: course is a PowerPoint demonstration intended to introduce.>")

