Download presentation
Presentation is loading. Please wait.

1
Scalable and comprehensive M&E systems for the increasingly complex, multi-site, multi-country, HIV prevention, care, and treatment programs Denis Nash, PhD, MPH Director, Monitoring, Evaluation, and Research Unit Columbia University, ICAP

2
M&E challenges in the context of rapid scale-up Rapid scale-up of sites –More sites from which to collect indicators Expanding portfolio of services and funding sources –New (additional) indicators to collect from sites Still missing some key indicators –e.g., deaths and LTF among pre-ART patients Poor data quality –Often a lack of infrastructure for recordkeeping and data management –Completeness and accuracy of paper-based systems Not always a priority at the site level Lack of simple yet robust data systems and skills to use them at sites –For aggregate information –For patient-level information
 indicators to collect from sites Still missing some key indicators –e.g., deaths and LTF among pre-ART patients Poor data quality –Often a lack of infrastructure for recordkeeping and data management –Completeness and accuracy of paper-based systems Not always a priority at the site level Lack of simple yet robust data systems and skills to use them at sites –For aggregate information –For patient-level information")
3
M&E challenges in the context of rapid scale-up Multiple reporting demands –Multiple entities require reports, often with different indicator requirements, deadlines, and reporting periods Some important aspects of programs are hard to capture with patient-focused or patient-driven indicators –e.g., family focused care or comprehensiveness of program Data dissemination and use of data –The data that are disseminated arent always being put to good use Why not???? Are the data actually useful? Are the data presented in a way that people can use them? Who is the right audience and are the data reaching the right audience?

4
Challenge: Rapid scale-up of sites; expanding portfolio of services and funding sources Response: Created a Site Census activity whereby basic info about new and existing sites is routinely updated by ICAP staff online –Planned/funded activities –Targets –Broken out by donor Number of ICAP/CU-supported sites by country (n=310)
")
5
Source: ICAP Site Census, September 2007 Number of ICAP-supported sites by activity, August 2007

6
Number of ICAP-required indicators by programmatic areas Care and treatment (166 indicators) PMTCT (42 indicators) TB/HIV(20 indicators) Coming soon: 1.Testing and Counseling 2.Laboratory
 PMTCT (42 indicators) TB/HIV(20 indicators) Coming soon: 1.Testing and Counseling 2.Laboratory")
8
Challenge: Still missing some key indicators Response: Planning to add a few key indicators to the existing list (mostly related to pre-ART patients) Collect and computerize good quality, patient-level data where possible SOPs for data collection
 Collect and computerize good quality, patient-level data where possible SOPs for data collection")
9
Challenge: Poor data quality Response: Developed a data quality SOP –Compare medical records vs. registers –Compare medical records vs. database Data entry checks Data quality queries Issues: Poor documentation in medical records –Whose job is it to shore up documentation? Not yet fully embraced by field staff

10
Care and treatment indicator collection and submission M&E Officer On-line reporting module (URS) MER Data Analyst Automated data checks Site BSite A Site B Automated data checks Manual data checks MER Liaison MER C&T Lead CDC-Atlanta Data queries M&E & Clinical staff Program Review M&E & Clinical staff USG
 MER Data Analyst Automated data checks Site BSite A Site B Automated data checks Manual data checks MER Liaison MER C&T Lead CDC-Atlanta Data queries M&E & Clinical staff Program Review M&E & Clinical staff USG")
11
Data quality assessment: Bishoftu Hospital, Ethiopia Variable% missing for ART patient visits (n=65) % missing for pre-ART patient visits (n=77) Visit date0%66% Weight0%69% Pregnancy73%93% WHO stage0%68% Opportunistic infection60%90% TB screen5%70% ART regimen0%n/a Cotrimoxazole6%81% Date of next visit0%71% Overall % missing11%75%
 % missing for pre-ART patient visits (n=77) Visit date0%66% Weight0%69% Pregnancy73%93% WHO stage0%68% Opportunistic infection60%90% TB screen5%70% ART regimen0%n/a Cotrimoxazole6%81% Date of next visit0%71% Overall % missing11%75%")
12
Challenge: Lack of simple/robust data systems as well as skills to use them at sites Response: Recruiting/retaining local database developers Remote and on-site TA to develop and implement systems Training

13
Challenge: Multiple reporting demands Response: Unified reporting system –Unifying factor: Site Census CIEIS IN Donor/MOH reports Maps Web components Data processing Outputs Datasets Data checks & cleaning QA Canned / ad hoc reports Data entry Data collection Detailed analyse s

14
Dashboards for summary statistics ICAP URS

15
Data entry modules for site census, care and treatment, pmtct, tb/hiv, p-facts

16
URS Data entry screen for OGAC care and treatment indicators

17
Challenge: Some important aspects of programs are hard to capture with patient-focused or patient-driven indicators Response: Created a Program and Facility Characteristics Tracking System (PFaCTS) –Info on program and facility characteristics are routinely and systematically captured using a standard instrument
 –Info on program and facility characteristics are routinely and systematically captured using a standard instrument")
19
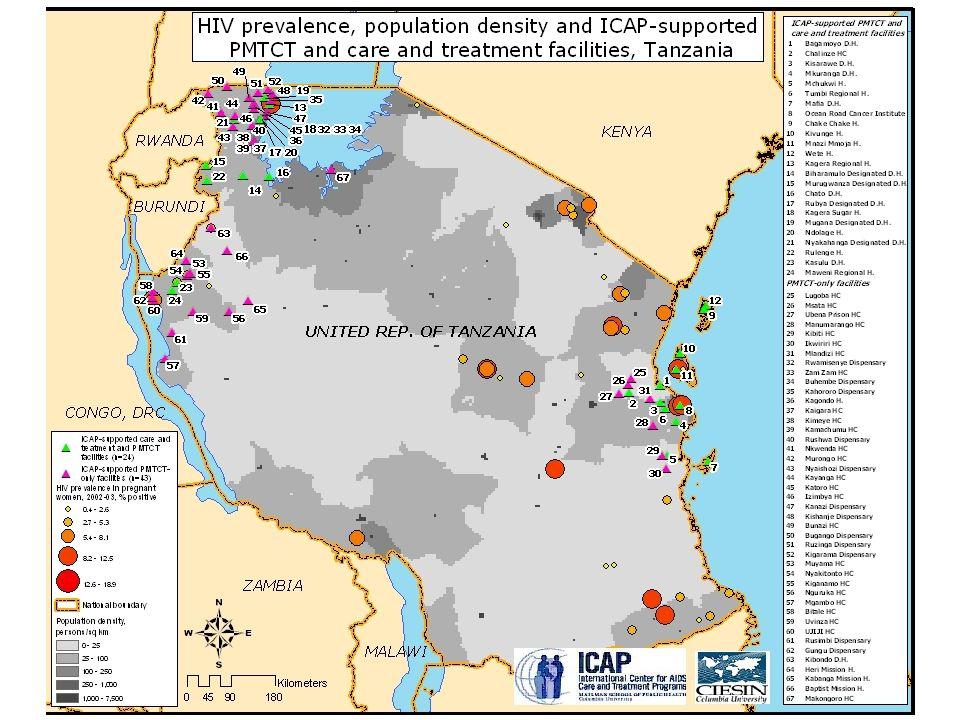
Location and type of ICAP-supported care and treatment facilities (n=177) Source: P-FaCTS, January 2007
 Source: P-FaCTS, January 2007")
20
On-site services at ICAP-supported care and treatment facilities (n=177) Source: P-FaCTS, January 2007 n=152/177n=165/177n=158/177n=142/177n=141/177
 Source: P-FaCTS, January 2007 n=152/177n=165/177n=158/177n=142/177n=141/177")
21
Patient support services at ICAP-supported care and treatment facilities (n=177) Source: P-FaCTS, January 2007 n=168/177n=45/177n=48/177n=49/177n=83/177
 Source: P-FaCTS, January 2007 n=168/177n=45/177n=48/177n=49/177n=83/177")
22
Challenge: Data dissemination and use of data Response: Data Dissemination website Unified reporting system –Combine reported data across programmatic areas to produce integrated analyses Data Dissemination meetings

23
Initiated ICAP data dissemination website

24
Automated summary reports

26
Target ART enrollment to February 2008 and actual enrollment by country at ICAP-supported facilities* as of June 2007 *Target data not available for Lesotho, Swaziland, or Zambia Source: ICAP Site Census, August 2007

27
Median number of staff per 1000 patients on ART at ICAP- supported care and treatment facilities by cadre (n=177) Source: P-FaCTS, January 2007
 Source: P-FaCTS, January 2007")
28
ART patients in more comprehensive programs may have better follow-up care 1 or 2 activities3 or 4 activities Median=44% Median=74% * Support activities include peer-educator program, outreach program nutritional support, adherence support Source: Quarterly report data and PFaCTS, January 2007 * p<0.01

29
Conclusions Need to augment conventional M&E systems to keep up with complexity of scale-up –Site census Important to capture indicators at multiple levels –Program and facility-level indicators (e.g., models of care) –Context Data quality is a major issue that is largely unaddressed Combining data from multiple levels and contexts can produce substantial synergy Dissemination –Need to be creative and provide data to those who need to know in a way that is useful and engaging
 –Context Data quality is a major issue that is largely unaddressed Combining data from multiple levels and contexts can produce substantial synergy Dissemination –Need to be creative and provide data to those who need to know in a way that is useful and engaging")
Similar presentations


 Track 1.0 Meeting - Maputo August 2010.>")


 Programs in 7 countries: Rosalind Carter, PhD Epidemiologist, PMTCT, Pediatrics.>")


