Download presentation
Presentation is loading. Please wait.

1
AAIR-2009 Student Academic and Learning Perceptions in an Australian University of Technology Presenter: Andrias Paramita – Senior Advisor RMIT Statistics & Reporting (www.rmit.edu.au/sr/contact us)
")
2
FOCUS Factors that affect student performance outcome CES – Course Experience Survey Cross tabulated CES & Student Demographic data Evaluating student satisfaction level on teaching and learning performance (progress rate)
")
3
1. Learning & Teaching Performance Fund – Pass rate as one of key performance indicator for fund allocation (DEEWR, 2009) 2. Using Grade Point Average (GPA) as finer measure of student performance (Dobson and Sharma, 1995) 3. Measurement points: – Data captured from CES (Course Experience Survey) semester-1 2008 which compulsory every semester (form http://alturl.com/92ik ) http://alturl.com/92ik – Survey population covers 69.1% of the study of University’s courses (1,440 number of courses surveyed) with 45,803 student respondent 4. Extract grades data of students who studied in semester-1 2008, recoded, summarized and aggregated by course code 5. Cumulative Grade Point Average (CGPA) calculation: The sum of grades / Number of courses Previous Study & Methodology
 2. Using Grade Point Average (GPA) as finer measure of student performance (Dobson and Sharma, 1995) 3. Measurement points: – Data captured from CES (Course Experience Survey) semester which compulsory every semester (form ) – Survey population covers 69.1% of the study of University’s courses (1,440 number of courses surveyed) with 45,803 student respondent 4. Extract grades data of students who studied in semester , recoded, summarized and aggregated by course code 5. Cumulative Grade Point Average (CGPA) calculation: The sum of grades / Number of courses Previous Study & Methodology.")
4
Result Student Performance and Demographics Variables

5
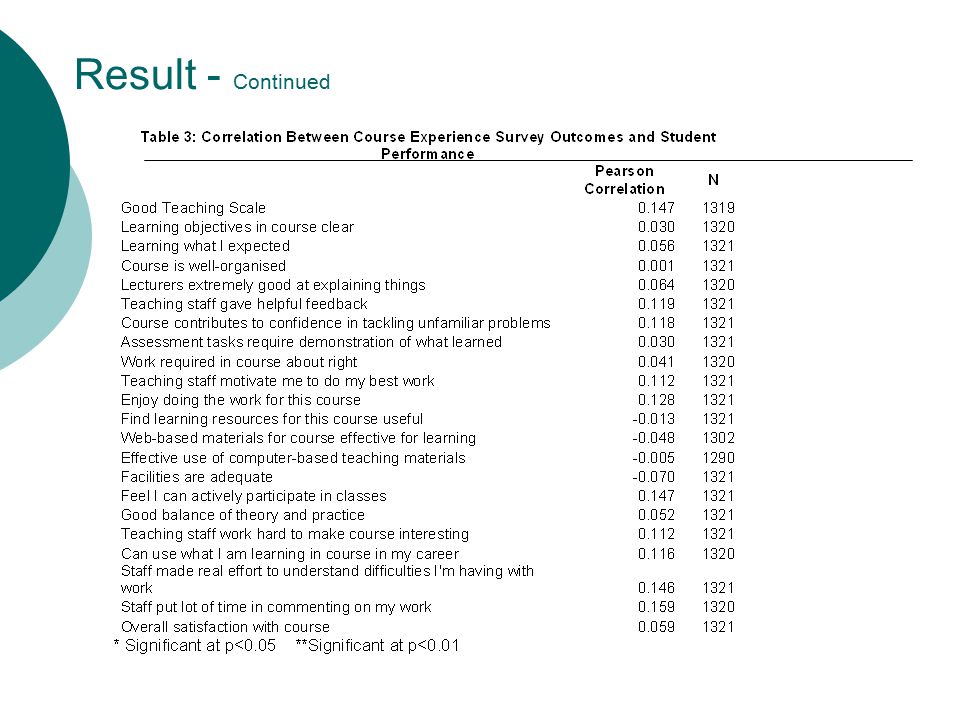
Result - Continued

7
Conclusion Students spending more out of class time, perform better than their counterparts. Academic staff have major role in terms of student performance Further research & studies required to investigate student pass rate that tend to improve with age

8
Questions & Answer Any questions? Thank you for your attentions Contact: andrias.paramita@rmit.edu.auandrias.paramita@rmit.edu.au

Similar presentations
 No 1828/2006.>")


 Report 2008-2009 Presented to ACISD Board of Trustees 12/17/2009 ARANSAS COUNTY ISD – A TEA RECOGNIZED SCHOOL.>")


 locked and key (Bill 2008)>")
>")

