Download presentation
Presentation is loading. Please wait.

1
Environmental impacts of groundwater intensification in India Sunderrajan Krishnan Trishikhi Raychoudhary Chaitali Purohit Ankit Patel

2
Definition of problem Any disturbance from the natural regime of groundwater flows or geochemistry caused by intensification of groundwater use that results in significant impact on environment and on humans Challenges: To define natural regime To isolate role of GW use on the impact, eg. coastal salinity

3
Which issues are being studied - Fall in water tables and rise in water tables regionally - Highly fluctuating water table - Quality problems emanating from exploitation eg. salinity in coastal areas, increasing mineralization of deeper aquifers, release of geogenic heavy metals associated with exploitation - Quality problems due to use of poor quality water for irrigation -Related surface water issues eg. tanks that recharge aquifers, being in disuse, partly due to gw use

4
Which issues are not considered - Pollution from industries; pollution from agrochemicals -Existing natural contaminants eg. Iron, Fluoride, Arsenic contamination – when existing without any disturbance - Ecological aspects eg. impact of phreatic plants due to deepening water tables, biomagnification of contaminants through environmental media

5
Building blocks of study Region based (4 regions) Issue Based (2 issues) Nation-wide analysis (at district level)
 Issue Based (2 issues) Nation-wide analysis (at district level)")
6
Building blocks of study Region based (4 regions) Issue Based (2 issues) Nation-wide analysis (at district level)
 Issue Based (2 issues) Nation-wide analysis (at district level)")
7
Nation-wide analysis at district level Objectives: To delineate zones of GW vulnerabilty using different criterion: a)Volumetric information: GW recharge, GW use for various purposes; Proportion GW used for irrigation b) Depth to Groundwater Table: Median depth to water table; Median fluctuation of water table c) Impact of well interference: well density and hydrogeology together impacting well interference Overlap these zones to mark regions of varying vulnerablity
Volumetric information: GW recharge, GW use for various purposes; Proportion GW used for irrigation b) Depth to Groundwater Table: Median depth to water table; Median fluctuation of water table c) Impact of well interference: well density and hydrogeology together impacting well interference Overlap these zones to mark regions of varying vulnerablity")
8
Nation-wide analysis at district level … cont’d Objectives: To demonstrate the impact of a)Variability b) Uncertainty in district level figures ; therefore also on looking at GW vulnerability using these figures This analysis will be performed for 5 districts by varying: 1. Rainfall: inter-annual variability 2. Uncertainty on Hydrogeological parameter: eg specific yield

9
Building blocks of study Region based (4 regions) Issue Based (2 issues) Nation-wide analysis (at district level)
 Issue Based (2 issues) Nation-wide analysis (at district level)")
10
- Bist-Doab of Punjab: overexploitation and agro- pollution; groundwater balance and trend analysis - North Gujarat: overexploitation, Fluoride, Salinity, urban exploitation and pollution - Coastal West Bengal and Orissa: saline water intrusion and urban subsidence of land - Central Tamil Nadu: Noyyal sub-basin of Cauvery: overexploitation, pollution, demand from urban areas Studies in four regions

11
Bist-Doab North Gujarat Coastal WB, N. Orissa Noyyal sub-basin of Cauvery

12
Studies in four regions Objectives: Detailed characterization of environmental impacts of groundwater use in the region Extrapolation to parts of the country that are similar to this region Eg. North Gujarat: overexploitation of aquifers; Fluoride contamination; Urban demand of groundwater from Ahmedabad area; Coastal and inland salinity of groundwater Can be extrapolated to parts of Rajasthan

13
Studies in four regions Fresh studies: - Collecting long-term groundwater hydrographs from Bist-Doab for better hold on groundwater balance - Collecting geochemical data in Baleshwar district, Orissa to delineate zones of differing salinity content

14
Building blocks of study Region based (4 regions) Issue Based (2 issues) Nation-wide analysis (at district level)
 Issue Based (2 issues) Nation-wide analysis (at district level)")
15
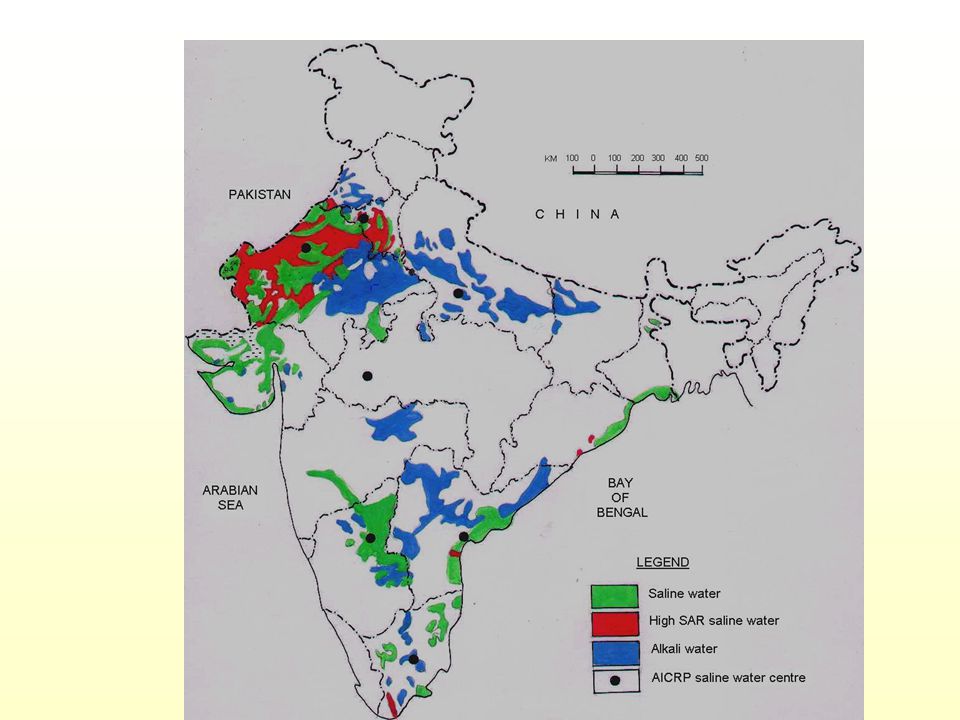
Issue 1: Coastal salinity of groundwater

16
Compiling the conceptual picture of coastal salinity across the coast Information on: Geomorphology, Hydrogeology, Tidal patterns, Observed salinity data Important regions: Gujarat (Kutch, Saurashtra, South Gujarat) Tamil Nadu (North) Central Andhra Pradesh Orissa (Central to North) West Bengal
 Tamil Nadu (North) Central Andhra Pradesh Orissa (Central to North) West Bengal")
17
Patterns of groundwater use in urban areas: - Major growth of urban areas is happening in 1,00,000 – 1 million population - Most of these cities are highly dependant on groundwater ; much more than million+ cities - The locus of future GW demand in urban areas will be these towns Main data: proportion dependence of urban area on GW Issue 2: Urban groundwater exploitation Million +1lakh – 1 Million 0 100 % dep On GW

18
Issue 2: Urban groundwater exploitation Aquifers in urban areas are increasingly exploited Data collection on coning in Ahmedabad city Subsidence problems (Kolkata) because of overexploitation The situation in various other cities: Chennai, Delhi, …
 because of overexploitation The situation in various other cities: Chennai, Delhi, …")
19
Structure of report Chapter 1: Summary Chapter 2: A national picture 2.1 National level statistics and District level analysis 2.2 A theoretical description of each specific impact and regions experiencing them Chapter 3: Analysis of four regions 3.1 Groundwater exploitation in Bist-Doab, Punjab 3.2 Exploitation, contamination and urban demands in North Gujarat 3.3. Salinity, Arsenic, Land subsidence and exploitation in Coastal West Bengal and North Orissa 3.4 Exploitation, pollution and urban demands for groundwater in Noyyal sub-basin of Cauvery in Tamil Nadu Chapter 4: Coastal salinity of groundwater in India Chapter 5: Groundwater exploitation in urban areas of India Chapter 6: An ecological look at groundwater exploitation

20
Timeline March: presentation in Anand on work till then - Preliminary analysis of nationwide district level data - Initial data collection from all 4 regions - A synthesis of coastal salinity - Presentation of collected data in urban groundwater study July: final report

23
Growth of Abstraction Structures (’000)
")
24
Cumulative Irrigation Potential Created from Ground Water (Mha)
")
26
Distribution of Fluoride in Ground Water

27
Objectives 1.Define coastal saline area of 500ppm 2.A plan view specifying different concentration saline area Very high saline area (salinity: more than7500mg/l) High saline area (salinity: 4000mg/l-7500mg/l) Moderate saline area (salinity: 1500mg/l-4000mg/l) Low saline area (salinity: 500mg/l-1500mg/l) 3.Construction of a pictorial view of vertical cross-section of Aquifer system of Indian coast 4.Pictorial vertical cross-sectional of saltwater intrusion mechanism of specified area. 5.Agricultural and Aquaculture activity of Indian coast 6.Preventive or Remedial measure taken in different part of Indian coast

28
Specific Objectives Geomorphology Coastal area specification and Geography, river basin and other natural surface details of the area Aquifer system coastal hydro-geology Salinity related study Surface soil-salinity condition Seasonal variation of saltwater and groundwater profile in a specific focused area Special variation of salinity over years (movement of salinity profile of fixed concentration over time) Groundwater table depletion over time in that area. ( to compare saltwater intrusion with groundwater depletion)
.")
29
Methodology 1.Data Collection Govt. Organization: CGWB, GSI, CSSRI, State Water and Irrigation Department (SWID) Non-Govt. Organization and Universities: Universities (BEC,Howrah etc) and NGOs Literature Review: Published papers and Books 2.Linking, analyzing and processing of data 3. Preparation of Report
 Non-Govt. Organization and Universities: Universities (BEC,Howrah etc) and NGOs Literature Review: Published papers and Books 2.Linking, analyzing and processing of data 3. Preparation of Report.")
30
Demographic study Maximum growth in urban population is occurring in 1,00000 to 1 million population cities Census population, 1971, 81, 91, 2001 & trend of 2011, 21, 31.. cities of > 1 millions : 34 cities Class I >100,000-1 million Class II = 50-100,000 Class III = 20-50,000 Class IV = 10-20,000 Total = 4378 cities > 1 millions = 35 cities Methodology: Review of demographic studies done by UNDP, Kundu et al., Census projections Individual studies done by others will be collected (literature review) for 35 cities. Total water use Proportion of SW & GW in total water use To take @ 20 cities from these 35 Patterns of present and future groundwater in urban areas
 for 35 cities. Total water use Proportion of SW & GW in total water use To 20 cities from these 35 Patterns of present and future groundwater in urban areas.")
31
For rest, 400 cities will be classified into broad category, class I 100,000 to 1 million and class II, III & IV as 10,000-100,000. We would consider Class I for our study Cities in different regions will be identified based on several factors (i.e. cities above hard rock strata/ with alluvium strata, river bank, coastal, hill stations, rainfall, GW quality) Probable Source of data for, total water use: Through, irrigation data - statewise (as many as possible), SW supply to the towns CGWB district water data & estimating GW use Sewerage disposal of towns & estimation of total water use Samples from various classifications - Tree, leaves @ 30 towns Check histograms of population -True Vs Sample, for both cities/towns Expected out put: Weighted Indicators with final GW use pattern, Ex. CART analysis (ref: Sunder)
 Probable Source of data for, total water use: Through, irrigation data - statewise (as many as possible), SW supply to the towns CGWB district water data & estimating GW use Sewerage disposal of towns & estimation of total water use Samples from various classifications - Tree, 30 towns Check histograms of population -True Vs Sample, for both cities/towns Expected out put: Weighted Indicators with final GW use pattern, Ex. CART analysis (ref: Sunder).")
Similar presentations


 ‘Parivesh Bhavan’, East Arjun Nagar.>")
 I.Bogotyrev (Mineral) G.Savenkova (Mineral) M.Naumovets (Mineral) G.Bogdanova.>")


