Download presentation
Presentation is loading. Please wait.

1
UBCM Health Promotion and Communities Workshop September 26, 2005 Cheeying Ho, Smart Growth BC Supporting Local Government Involvement in Community Health Promotion

2
Outline Smart Growth BC Principles of smart growth Health impacts of current planning system Summary of research findings Local government role Policies to advance healthy communities

3
Province wide, non-profit, non- governmental organisation Founded in 1999 5 staff; board of 10-12 Funded by foundations, grants, programs/fees and donations Work with community groups, local government, businesses to increase livability Who is Smart Growth BC?

4
What is smart growth Smart Growth is a collection of development strategies that enhance our quality of life, protect our environment, and use tax revenues wisely Managing growth Providing choice

5
Vibrant cities, suburbs and towns Not anti-suburban Wider variety of housing choices Not about telling people where or how to live More transportation choices and less traffic Not against cars and roads Well-planned growth that improves quality of life Not against growth The “where and how” of growth What is Smart Growth?

6
Smart Growth Principles

7
1.1. Mix land uses. 2.2. Build compact neighbourhoods. 3.3. Provide a variety of transportation choices. 4.4. Create diverse housing opportunities. 5.5. Encourage growth in existing communities. 6.6. Preserve open spaces, natural beauty, and environmentally sensitive areas. 7.7. Maintain agricultural lands. 8.8. Utilize smarter, and cheaper infrastructure and buildings. 9.9. Foster a unique neighbourhood identity. 10.10. Nurture engaged citizens.

8
What’s Wrong with the Current System?

9
Segregation – housing, retail, businesses all separated Automobile oriented development necessitating driving; poorly suited for walking, bicycling or transit What’s Wrong with the Current System?

10
Environmental Impacts Air pollution Excess pavement and habitat loss Disposal of used cars/parts

11
Financial Impacts Costs to individuals to buy, insure, maintain, and gas up: –CAA estimates about $8,000/year Costs to taxpayers of building and repairing roads, bridges, parking lots, stormwater systems... –$70 billion in GTA over next 25 years

12
Source: Transportation Cooperative Research Program Costs of Services Difference is $100 B!

13
Social Impacts Loss of community identity and uniqueness Anytown, North America

14
Social Impacts Lack of housing and transportation choices

15
Social Impacts Health –Air pollution –Traffic accidents –Lack of access to services and amenities –Physical activity, obesity

16
Research findings Significant research has been done in the area of urban form and health: American Journal of Health Promotion American Journal of Preventative Medicine Canadian Institute for Health Promotion Robert Wood Johnson Foundation Smart Growth America Canadian Heart and Stroke Foundation Ontario College of Family Physicians Centers for Disease Control

17
Obesity* Trends Among U.S. Adults BRFSS, 1985 (*BMI 30, or ~ 30 lbs overweight for 5’4” person) No Data <10% 10%-14% 15-19% 20% Source: BRFSS, CDC.
 No Data <10% 10%-14% 15-19% 20% Source: BRFSS, CDC..")
18
Obesity* Trends Among U.S. Adults BRFSS, 1987 (*BMI 30, or ~ 30 lbs overweight for 5’4” person) No Data <10% 10%-14% 15-19% 20% Source: BRFSS, CDC.
 No Data <10% 10%-14% 15-19% 20% Source: BRFSS, CDC..")
19
Obesity* Trends Among U.S. Adults BRFSS, 1989 (*BMI 30, or ~ 30 lbs overweight for 5’4” person) No Data <10% 10%-14% 15-19% 20% Source: BRFSS, CDC.
 No Data <10% 10%-14% 15-19% 20% Source: BRFSS, CDC..")
20
Obesity* Trends Among U.S. Adults BRFSS, 1991 (*BMI 30, or ~ 30 lbs overweight for 5’4” person) No Data <10% 10%-14% 15-19% 20%
 No Data <10% 10%-14% 15-19% 20%.")
21
Obesity* Trends Among U.S. Adults BRFSS, 1993 (*BMI 30, or ~ 30 lbs overweight for 5’4” person) No Data <10% 10%-14% 15-19% 20%
 No Data <10% 10%-14% 15-19% 20%.")
22
Obesity* Trends Among U.S. Adults BRFSS, 1995 (*BMI 30, or ~ 30 lbs overweight for 5’4” person) No Data <10% 10%-14% 15-19% 20%
 No Data <10% 10%-14% 15-19% 20%.")
23
Obesity* Trends Among U.S. Adults BRFSS, 1997 (*BMI 30, or ~ 30 lbs overweight for 5’4” person) No Data <10% 10%-14% 15-19% 20% Source: BRFSS, CDC.
 No Data <10% 10%-14% 15-19% 20% Source: BRFSS, CDC..")
24
Obesity* Trends Among U.S. Adults BRFSS, 1999 (*BMI 30, or ~ 30 lbs overweight for 5’4” person) No Data <10% 10%-14% 15-19% 20% Source: BRFSS, CDC.
 No Data <10% 10%-14% 15-19% 20% Source: BRFSS, CDC..")
25
SMARTRAQ SMARTRAQ Partner Agencies Strategies for Metropolitan Atlanta’s Regional Transportation and Air Quality

26
SMARTRAQ $4 million, 7 year study, 8000 households Higher levels of land-use mix, residential density, employer density and street connectivity are associated with: fewer vehicles miles traveled. reduced emissions contributing to air pollution. greater use of public transit. increased physical activity.

27
SMARTRAQ Every additional 30 minutes a person spends in a car translates into a 3 percent greater chance of being obese. People who live in neighborhoods with a mix of shops and businesses within easy walking distance are 7 percent less likely to be obese, lowering their relative risk of obesity by 35 percent.

28
Heart and Stroke Foundation 2005 Report Card Has the American Dream Gone Sour? Car-dependent Canadians get far less physical activity and are at increased risk of being overweight or obese Almost 50% of Canadian adults and 37% of Canadian children are now either overweight or obese. Individuals living in moderate-to-high density neighbourhoods that have community and commercial services within walking distance of where they live, are 2.4 times more likely to meet this 30-minute daily minimum [recommendation to be physically active]

29
Ontario College of Family Physicians Report on Public Health and Urban Sprawl in Ontario Sprawling urban developments lead to increased driving which contributes to increased air pollution with negative impacts on human health People who live in spread-out, car-dependent neighborhoods are likely to walk less, weigh more, and suffer from obesity and high blood pressure and consequent diabetes, cardio-vascular and other diseases, as compared to people who live in more efficient, higher density communities Urban (or suburban) sprawl leads to increased traffic, which in turn leads to increased accidents and fatalities (motorists, pedestrians and cyclists), as well as negative mental health impacts (stress, road rage and anxiety).
 sprawl leads to increased traffic, which in turn leads to increased accidents and fatalities (motorists, pedestrians and cyclists), as well as negative mental health impacts (stress, road rage and anxiety).")
30
Smart Growth BC Report Examined urban form factors (density, mix, street connectivity, centredness, parking supply and management, street design, transit access and active transportation improvements) on health factors (physical fitness, traffic accidents, air pollution exposure, access)
 on health factors (physical fitness, traffic accidents, air pollution exposure, access)")
31
Smart Growth BC Report Emphasized the benefits of mixed use and density on physical activity as well as overall health Stressed importance of street connectivity for walking as well as the presence of active transportation infrastructure Parking management strategies can encourage a shift from driving to other modes of transportation

32
2 km Dr. Lawrence Frank, UBC Street connectivity 0.8 km

33
Access to recreation Average Distance Traveled to Recreate Average Distance Traveled to Recreate Source: 1996 Puget Sound Transportation Panel Year of Home Census Tract Development After 19771963 to 19771947 to 1962Prior to 1947 Mean DISTANCE (miles) 9 8 7 6 5 4 3 Seattle Data Dr. Lawrence Frank, UBC

34
Role of local governments Set policies, by-laws, zoning codes for better land use and transportation Implement regional growth strategies to plan for long-term, regional land use in conjunction with transportation, housing and economic development Provide education on benefits of compact, walkable communities and the importance of physical activity

35
Policies for local government Land use Increase density to support transit and walkability Zone for mixed-use neighbourhoods to encourage accessibility and walkability Protect and integrate greenspace Plan for town and neighbourhood centres Develop in existing urbanised areas (infill)
")
36
Policies for local government Design Create pedestrian friendly streets (wide sidewalks, street lighting, awnings, storefronts facing the street, street trees, etc) Increase connectivity of streets
 Increase connectivity of streets")
37
Policies for local government Transportation Provide efficient public transit (requires sufficient density) Implement parking management strategies (pricing, supply, etc) Provide infrastructure and facilities for alternative transportation modes (walkways, bikeways, bikes on buses, bike racks)
 Implement parking management strategies (pricing, supply, etc) Provide infrastructure and facilities for alternative transportation modes (walkways, bikeways, bikes on buses, bike racks)")
40
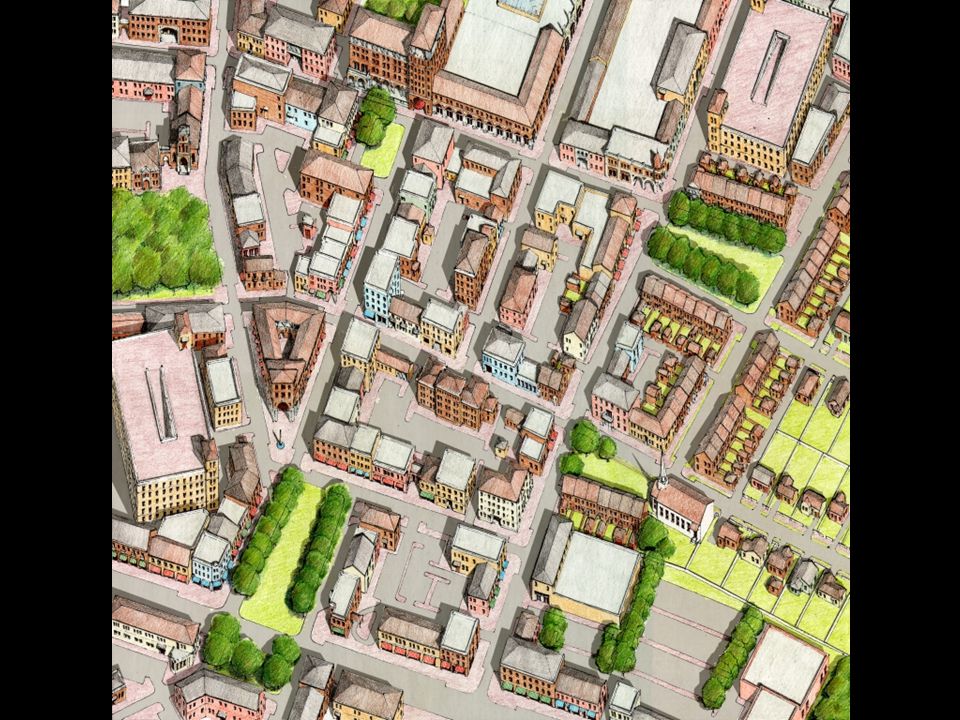
Infill Development Urban-Advantage.com www.urban-advantage.com

41
“Healthy by Design” “Any busy downtown sidewalk will reveal the mystery of why Vancouverites are an uncommonly vigorous and healthy bunch and why their city is so widely admired. Stand on Robson Street for five minutes on a weekday afternoon. Count the people walking past: 346. Note the number who are obviously overweight: 2. Estimate the number wearing backpacks: 100. Now take another five minutes to count the cars moving steadily and easily past: 74 (plus two trucks and three buses). Reach for your calculator: 4.5 pedestrians for every car. There you have it. Not exactly scientific proof, but an insight into Vancouver’s formula for health residents and urban vitality: more walking, less driving. More than any North American city, Vancouver has intentionally merged public health with city planning. The goal is not just to promote recreation (there are plenty of bike trails and tennis courts), but to design physical activity into the daily routine, to build a city so compelling that people will leave their cars at home, strap on a backpack and take up walking as their primary mode of travel.” Steve Berg, Star Tribune (Minneapolis/St Paul)
. Reach for your calculator: 4.5 pedestrians for every car. There you have it. Not exactly scientific proof, but an insight into Vancouver’s formula for health residents and urban vitality: more walking, less driving. More than any North American city, Vancouver has intentionally merged public health with city planning. The goal is not just to promote recreation (there are plenty of bike trails and tennis courts), but to design physical activity into the daily routine, to build a city so compelling that people will leave their cars at home, strap on a backpack and take up walking as their primary mode of travel. Steve Berg, Star Tribune (Minneapolis/St Paul).")
42
Thank you to Dr. Larry Frank for use of his slides and information from the SMARTRAQ study. (Dr. Frank was the lead author of the SMARTRAQ study and now the Bombardier Chair in Transportation in the School of Planning at UBC)
.")
43
For more information www.smartgrowth.bc.ca

Similar presentations


![HEALTHY COMMUNITY DESIGN Planning and designing communities that make it easier for people to live healthy lives [presenter name/title here/affiliation]](/8/2309633/big_thumb.jpg "HEALTHY COMMUNITY DESIGN Planning and designing communities that make it easier for people to live healthy lives [presenter name/title here/affiliation]>")


