Download presentation
Presentation is loading. Please wait.

1
Graduate Labour Market Cher Li and Robert E. Wright Department of Economics

2
Higher education institutions produce goods and services Examples: Knowledge Research Patents and other intellectual property Consulting services Accommodation services Conference services One main output is skilled labour HEIs produce workers

3
One of our objectives is to quantify the nature of graduate labour market flows Why? Not a great deal is know about this. Regional focus: England, Scotland, Wales and Northern Ireland Interested in the export and import of graduates Information along these lines will be fed into the CGE analysis

4
Data Sources Need micro-data No single data sources available Surveys such as the BHPS, LFS, NES, GHS and FRS can be used. Higher Education Statistical Agency (HESA) data
 data.")
5
HESA is the official agency for the collection, analysis and dissemination of quantitative information about higher education. Four main data banks (1) Destinations of leavers from HEIs (2) Students in HEIs (3) Staff in HEIs (4) Financial aspects of HEIs 12 waves available from 1994/95 to 2005/2006
 Destinations of leavers from HEIs (2) Students in HEIs (3) Staff in HEIs (4) Financial aspects of HEIs 12 waves available from 1994/95 to 2005/2006.")
6
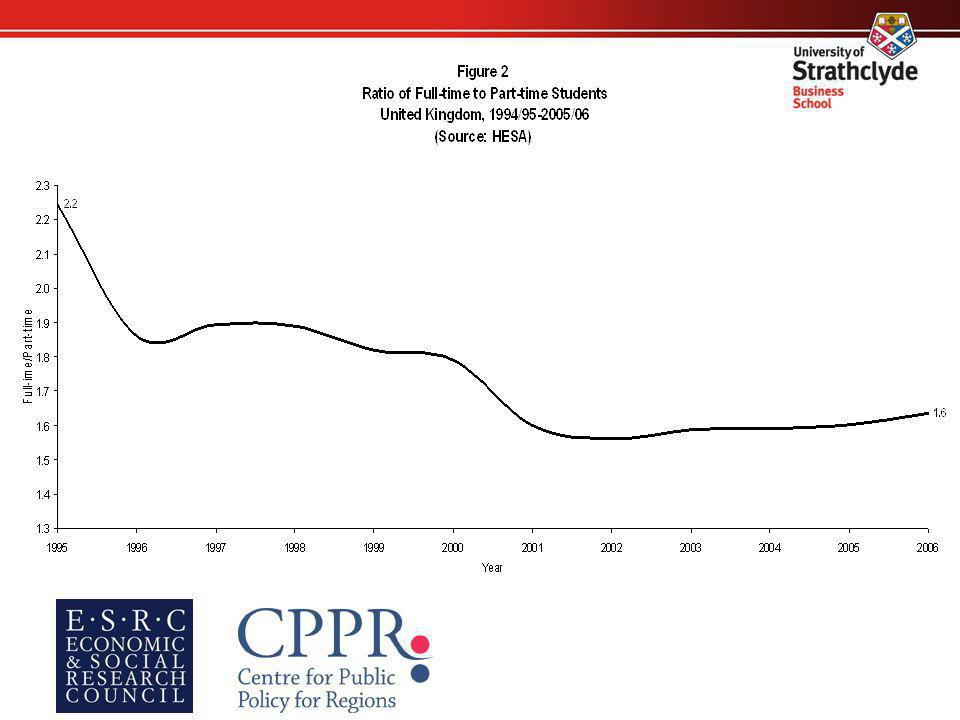
2. Trends at United Kingdom Level

15
3. Regional Trends

16
Number of Students (Source: HESA) Region1994/952005/06% Change England1,302,1821,936,43048.7 Scotland 148,908 215,82044.9 Wales 80,125 129,22561.3 Northern Ireland 36,098 54,630 51.3 United Kingdom1,567,3132,336,10549.1
 Region1994/952005/06% Change England1,302,1821,936, Scotland 148, , Wales 80, , Northern Ireland 36,098 54, United Kingdom1,567,3132,336,")
17
Population Shares and Student Shares 2005/06 (Source: HESA) Share of studentsShare of UK Population England 82.983.8 Scotland 9.28.4 Wales 5.54.9 NI 2.32.9
 Share of studentsShare of UK Population England Scotland Wales NI")
18
Regional Growth Rates (Percentages) of Various Student Groups, 1994/95-2005/06 Type of Student:EnglandScotlandWalesNIUK Full-time34.825.521.438.333.1 Part-time76.7120.8195.984.0 Under-graduates44.740.758.258.345.4 Post-graduates63.459.575.430.162.6 Foreign107.891.372.722.4101.6 Science73.858.159.266.971.1 Non-science35.035.162.539.236.5
 of Various Student Groups, 1994/ /06 Type of Student:EnglandScotlandWalesNIUK Full-time Part-time Under-graduates Post-graduates Foreign Science Non-science")
20
4. Employment

21
Place of Domicile/Place of Study 2005/06 (Source: HESA) Place of Study EnglandScotlandWalesNI Place of Domicile England929,0557,24520,2458,305 Scotland16,050103,9754704,710 Wales28,71521035,555300 NI310601031,770
 Place of Study EnglandScotlandWalesNI Place of Domicile England929,0557,24520,2458,305 Scotland16,050103, ,710 Wales28, , NI ,770")
22
Place of Domicile and Place of Study Scotland and Wales, 2005/06 (Source: HESA) Place of Study ScotlandWales DomicileN%N% England16,05013%28,71544% Scotland103,97583%2100.3% Wales4700.4%35,55555% NI4,7104%3000.5% All125205 64780
 Place of Study ScotlandWales DomicileN%N% England16,05013%28,71544% Scotland103,97583%2100.3% Wales4700.4%35,55555% NI4,7104%3000.5% All")
23
Place of Study/Place of Employment Matrix 2005-06 (Source: HESA) Place of Employment EnglandScotlandWalesNI Place of Study England188,6701,8202,390885 Scotland2,35019,09055275 Wales4,315657,83030 NI28070106,205
 Place of Employment EnglandScotlandWalesNI Place of Study England188,6701,8202, Scotland2,35019, Wales4,315657,83030 NI ,205")
24
Percentage of Graduates Whose Place of Work is the Same as Their Place of Study (Source: HESA) England97.4 Scotland87.7 Wales64.0 NI94.5
 England97.4 Scotland87.7 Wales64.0 NI94.5")
25
Percentage of Graduates From Different Regions Working in England, 2005/06 (Source: HESA) Scotland10.8 Wales35.3 NI4.3
 Scotland10.8 Wales35.3 NI4.3")
26
4. Future Directions Socio-economic characteristics of regional graduate flows Returns to higher education (earnings differences) Changes in returns over time Over-education? Education policy and participation rates. Selection issues?
 Changes in returns over time Over-education. Education policy and participation rates. Selection issues .")
Similar presentations


 Bydanova L., Post-doctorate, IREDU.>")


 Department of Business, Innovation and Skills (BIS) Working Party on Trade in Goods and Services.>")


 Economics Business Studies B C D E U A* All Subjects Maths A B C D E U A B C D E U A* A B C D E U A.>")


 PROJECT Achieving Impact – Socio-Economic Sciences & Humanities International Conference, Athens.>")