Download presentation
Presentation is loading. Please wait.

1
Ag Outlook Clear Lake Bank & Trust Ag Meeting Clear Lake, Iowa
Jan. 22, 2014 Chad Hart Associate Professor/Crop Markets Specialist 1 1

2
U.S. Corn Supply and Use 2009 2010 2011 2012 2013 Area Planted
(mil. acres) 86.4 88.2 91.9 97.2 95.4 Yield (bu./acre) 164.7 152.8 147.2 123.4 158.8 Production (mil. bu.) 13,092 12,447 12,360 10,780 13,925 Beg. Stocks 1,673 1,708 1,128 989 821 Imports 8 28 29 162 35 Total Supply 14,774 14,182 13,517 11,932 14,781 Feed & Residual 5,125 4,795 4,557 4,335 5,300 Ethanol 4,591 5,019 5,000 4,648 Food, Seed, & Other 1,370 1,407 1,428 1,396 1,400 Exports 1,980 1,834 1,543 731 1,450 Total Use 13,066 13,055 12,528 11,111 13,150 Ending Stocks 1,631 Season-Average Price ($/bu.) 3.55 5.18 6.22 6.89 4.40 Source: USDA-WAOB 2 2
 Yield. (bu./acre) Production. (mil. bu.) 13, , , , ,925. Beg. Stocks. 1,673. 1,708. 1, Imports Total Supply. 14, , , , ,781. Feed & Residual. 5,125. 4,795. 4,557. 4,335. 5,300. Ethanol. 4,591. 5,019. 5,000. 4,648. Food, Seed, & Other. 1,370. 1,407. 1,428. 1,396. 1,400. Exports. 1,980. 1,834. 1, ,450. Total Use. 13, , , , ,150. Ending Stocks. 1,631. Season-Average Price. ($/bu.) Source: USDA-WAOB")
3
U.S. Soybean Supply and Use
2009 2010 2011 2012 2013 Area Planted (mil. acres) 77.5 77.4 75.0 77.2 76.5 Yield (bu./acre) 44.0 43.5 41.9 39.8 43.3 Production (mil. bu.) 3,359 3,329 3,094 3,034 3,289 Beg. Stocks 138 151 215 169 141 Imports 15 14 16 36 25 Total Supply 3,512 3,495 3,325 3,239 3,454 Crush 1,752 1,648 1,703 1,689 1,700 Seed & Residual 110 130 88 90 109 Exports 1,499 1,501 1,365 1,320 1,495 Total Use 3,361 3,280 3,155 3,099 3,304 Ending Stocks 150 Season-Average Price ($/bu.) 9.59 11.30 12.50 14.40 Source: USDA-WAOB 3 3
 Yield. (bu./acre) Production. (mil. bu.) 3,359. 3,329. 3,094. 3,034. 3,289. Beg. Stocks Imports Total Supply. 3,512. 3,495. 3,325. 3,239. 3,454. Crush. 1,752. 1,648. 1,703. 1,689. 1,700. Seed & Residual Exports. 1,499. 1,501. 1,365. 1,320. 1,495. Total Use. 3,361. 3,280. 3,155. 3,099. 3,304. Ending Stocks Season-Average Price. ($/bu.) Source: USDA-WAOB")
4
Corn Yields Top: 2013 Yield Bottom: Change from 2012
Units: Bushels/acre Source: USDA-NASS

5
Soybean Yields Top: 2013 Yield Bottom: Change from 2012
Units: Bushels/acre Source: USDA-NASS

6
World Corn Production Source: USDA-WAOB 6 6

7
World Soybean Production
Source: USDA-WAOB 7 7

8
World Weather Source: USDC and USDA 8 8

9
Hog Crush Margin The Crush Margin is the return after the pig, corn and soybean meal costs. Carcass weight: 200 pounds Pig price: 50% of 5 mth out lean hog futures Corn: 10 bushels per pig Soybean meal: 150 pounds per pig Source: ISU Extension

10
Cattle Crush Margin The Crush Margin is the return after the feeder steer and corn costs. Live weight: pounds Feeder weight: 750 pounds Corn: 50 bushels per head Source: ISU Extension

11
Corn Export Shifts Source: USDA-FAS

12
Corn Export Sales Source: USDA-FAS

13
Soybean Export Sales Source: USDA-FAS

14
Soy Export Shifts Source: USDA-FAS

15
Corn Grind for Ethanol

16
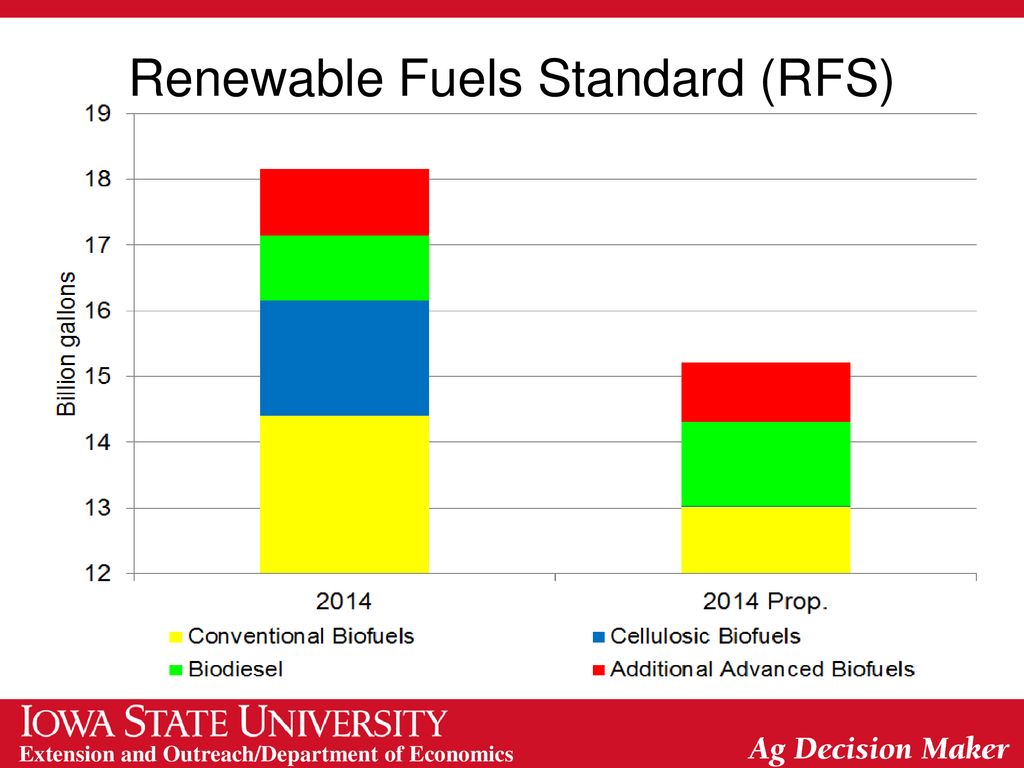
Renewable Fuels Standard (RFS)
16 16
17
Source: DOE-EIA, Annual Energy Outlook

18
(Million Barrels Oil Equivalent per Day)
Liquid Fuel Usage 2010 2015 2020 2025 2030 2035 (Million Barrels Oil Equivalent per Day) (Percent of 2010 Value) United States 18.9 101% 103% 99% 98% Canada 2.2 100% Mexico 2.4 105% 110% 117% 127% 138% Europe 14.8 91% 93% 94% Japan 4.4 106% 97% China 9.3 125% 146% 165% 178% 195% India 3.3 113% 134% 158% 186% 217% Africa 3.4 107% 112% 119% 126% Central and South America 6.0 108% 114% 121% 128% World 86.7 111% 116% 120% Source: DOE-EIA
 (Percent of 2010 Value) United States % 103% 99% 98% Canada % Mexico % 110% 117% 127% 138% Europe % 93% 94% Japan % 97% China % 146% 165% 178% 195% India % 134% 158% 186% 217% Africa % 112% 119% 126% Central and South America % 114% 121% 128% World % 116% 120% Source: DOE-EIA.")
19
Current Corn Futures 4.40 4.35 4.29 Source: CME Group, 1/22/2014

20
Current Soybean Futures
12.57 10.81 10.61 Source: CME Group, 1/22/2014

21
Corn Prices vs. Costs Per Bushel Cost calculated as Per Acre Cost from ISU Extension divided by Actual Yield per Acre Sources: USDA-NASS for Prices, Duffy for Costs

22
Soybean Prices vs. Costs
Per Bushel Cost calculated as Per Acre Cost from ISU Extension divided by Actual Yield per Acre Sources: USDA-NASS for Prices, Duffy for Costs

23
Crop Acreage Source: USDA-NASS

24
2013/14 Crop Prices

25
2014/15 Crop Margins

26
Thoughts for 2014 and Beyond
Supply/demand concerns Demand rebounding? Yes, so far, so good Acreage allocation for 2014: Where do the extra corn acres go? Markets favoring soybeans in the short term and corn longer term 2012/13 USDA 2013/14 USDA 2013/14 Futures (1/22/14) 2014/15 Corn $6.89 $4.40 $4.35 $4.29 Soybeans $14.40 $12.50 $12.57 $10.81
 2014/15. Corn. $6.89. $4.40. $4.35. $4.29. Soybeans. $ $ $ $")
27
Population 2013 2020 2050 (billion) World 7.095 7.628 9.383 China
2020 2050 (billion) World 7.095 7.628 9.383 China 1.350 1.385 India 1.657 1.221 1.326 1.304 U.S. 0.317 0.337 0.423 Indonesia 0.251 0.267 Nigeria 0.402 Brazil 0.201 Pakistan 0.214 0.300 0.193 0.212 0.291 0.175 0.208 Bangladesh 0.250 0.164 0.183 0.232 Russia 0.143 0.142 Ethiopia 0.228 Japan 0.127 0.126 Philippines 0.172 Source: U.S. Bureau of the Census
 World China India U.S Indonesia Nigeria Brazil Pakistan Bangladesh Russia Ethiopia Japan Philippines Source: U.S. Bureau of the Census.")
28
World Corn Markets Source: USDA 28 28

29
Arable Land

30
Thank you for your time. Any questions. My web site: http://www. econ
Thank you for your time! Any questions? My web site: Iowa Farm Outlook: Ag Decision Maker:

Similar presentations


