Download presentation
Presentation is loading. Please wait.

1
Current Grain Market Values
Crop Challenges for 2013 Charles City, Iowa Dec. 14, 2012 Chad Hart Associate Professor/Grain Markets Specialist 1 1

2
U.S. Corn Supply and Use 2008 2009 2010 2011 2012 Area Planted
(mil. acres) 86.0 86.4 88.2 91.9 96.9 Yield (bu./acre) 153.9 164.7 152.8 147.2 122.3 Production (mil. bu.) 12,092 13,092 12,447 12,358 10,725 Beg. Stocks 1,624 1,673 1,708 1,128 988 Imports 14 8 28 29 100 Total Supply 13,729 14,774 14,182 13,515 11,814 Feed & Residual 5,182 5,125 4,795 4,547 4,150 Ethanol 3,709 4,591 5,019 5,011 4,500 Food, Seed, & Other 1,316 1,370 1,407 1,426 1,367 Exports 1,849 1,980 1,834 1,543 1,150 Total Use 12,056 13,066 13,055 12,527 11,167 Ending Stocks 647 Season-Average Price ($/bu.) 4.06 3.55 5.18 6.22 7.40 Source: USDA-WAOB 2 2
 Yield. (bu./acre) Production. (mil. bu.) 12, , , , ,725. Beg. Stocks. 1,624. 1,673. 1,708. 1, Imports Total Supply. 13, , , , ,814. Feed & Residual. 5,182. 5,125. 4,795. 4,547. 4,150. Ethanol. 3,709. 4,591. 5,019. 5,011. 4,500. Food, Seed, & Other. 1,316. 1,370. 1,407. 1,426. 1,367. Exports. 1,849. 1,980. 1,834. 1,543. 1,150. Total Use. 12, , , , ,167. Ending Stocks Season-Average Price. ($/bu.) Source: USDA-WAOB")
3
U.S. Soybean Supply and Use
2008 2009 2010 2011 2012 Area Planted (mil. acres) 75.7 77.5 77.4 75.0 77.2 Yield (bu./acre) 39.7 44.0 43.5 41.9 39.3 Production (mil. bu.) 2,967 3,359 3,329 3,094 2,971 Beg. Stocks 205 138 151 215 169 Imports 13 15 14 16 20 Total Supply 3,185 3,512 3,495 3,325 3,160 Crush 1,662 1,752 1,648 1,703 1,570 Seed & Residual 106 110 130 90 116 Exports 1,279 1,499 1,501 1,362 1,345 Total Use 3,047 3,361 3,280 3,155 3,031 Ending Stocks Season-Average Price ($/bu.) 9.97 9.59 11.30 12.50 14.55 Source: USDA-WAOB 3 3
 Yield. (bu./acre) Production. (mil. bu.) 2,967. 3,359. 3,329. 3,094. 2,971. Beg. Stocks Imports Total Supply. 3,185. 3,512. 3,495. 3,325. 3,160. Crush. 1,662. 1,752. 1,648. 1,703. 1,570. Seed & Residual Exports. 1,279. 1,499. 1,501. 1,362. 1,345. Total Use. 3,047. 3,361. 3,280. 3,155. 3,031. Ending Stocks. Season-Average Price. ($/bu.) Source: USDA-WAOB")
4
Prices

5
Projected Corn Yields

6
Projected Soybean Yields

7
World Corn Production Source: USDA-WAOB 7 7

8
World Soybean Production
Source: USDA-WAOB 8 8

9
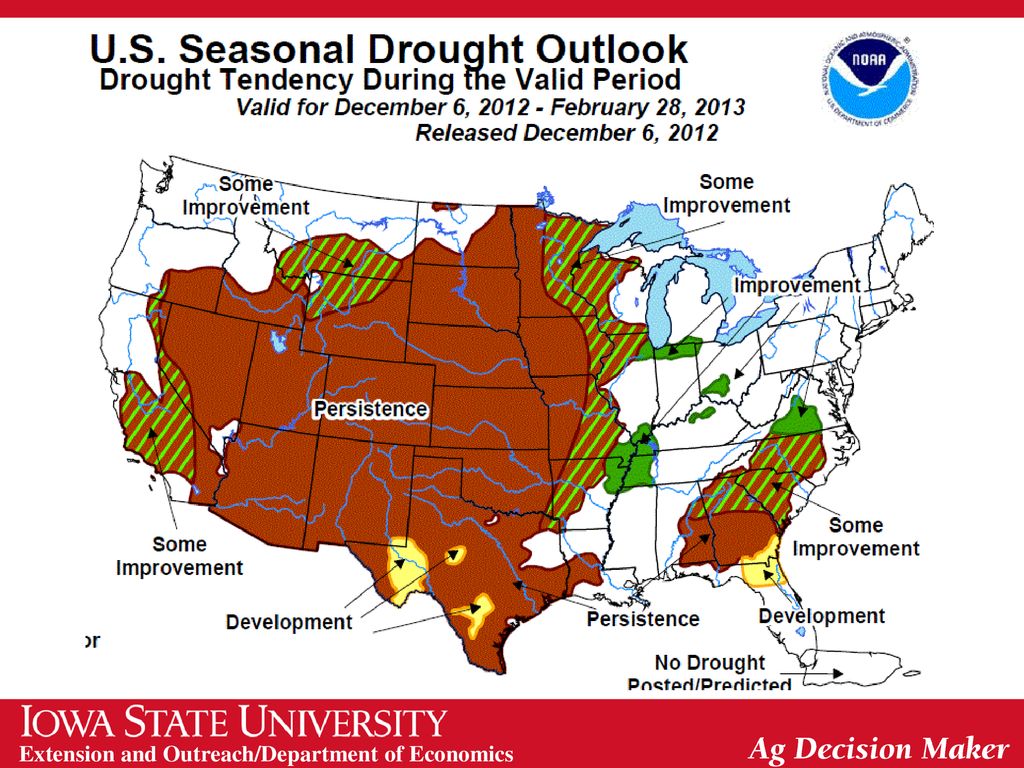
World Weather Source: USDC and USDA 9 9

10
Hog Crush Margin The Crush Margin is the return after the pig, corn and soybean meal costs. Carcass weight: 200 pounds Pig price: 50% of 5 mth out lean hog futures Corn: 10 bushels per pig Soybean meal: 150 pounds per pig Source: ISU Extension

11
Cattle Crush Margin The Crush Margin is the return after the feeder steer and corn costs. Live weight: pounds Feeder weight: 750 pounds Corn: 50 bushels per head Source: ISU Extension

12
U.S. Meat Production & Prices
Source: USDA-WAOB 12 12

13
Corn Export Shifts Source: USDA-FAS

14
Soy Export Shifts Source: USDA-FAS

15
Corn Grind for Ethanol Negative margins at some ethanol plants have dragged down production.

16
U.S. Blended Gasoline Consumption
7.6 bil. gal. But the industry still faces blend wall issues as fuel consumption has dropped with the economy and the E-10 market is basically full. 7.4 bil. gal. Source: DOE-EIA, via USDA-ERS

17
Current Corn Futures 6.68 5.89 5.55 Source: CME Group, 12/13/2012

18
Current Soybean Futures
13.91 12.47 12.03 Source: CME Group, 12/13/2012

19
Total Acreage Shift Source: USDA-NASS
We brought back a lot of acres in Can we hold them in 2013? Source: USDA-NASS

20
Acreage Shift by Crop Acreage change from 2011 Units: 1,000 acres
Cotton will likely give up acreage again. But with crop prices strong across the board, the acreage battle could be interesting in 2013. Source: USDA-NASS

21
Acreage Shift by State Top: Planted in 2012 Bottom: Change from 2011
Weather was great for planting in 2012 (just not for producing). To hold acreage we will need great planting weather again. Top: Planted in 2012 Bottom: Change from 2011 Units: 1,000 acres Source: USDA-NASS
. To hold acreage we will need great planting weather again. Top: Planted in Bottom: Change from Units: 1,000 acres. Source: USDA-NASS.")
23
Thoughts for 2013 and Beyond
Supply/demand concerns Soil moisture issues Biofuel and export strength Worldwide response to drought-induced pricing 2012/13 USDA Futures (12/13/12) 2013/14 Corn $7.40 $6.68 $5.89 Soybeans $14.55 $13.91 $12.47 Risk management Crop insurance Price protection
 2013/14. Corn. $7.40. $6.68. $5.89. Soybeans. $ $ $ Risk management. Crop insurance. Price protection.")
24
Thank you for your time. Any questions. My web site: http://www. econ
Thank you for your time! Any questions? My web site: Iowa Farm Outlook: Ag Decision Maker:

Similar presentations