Download presentation
Presentation is loading. Please wait.

1
Freshwater Sustainability Thomas M. Parris April 3, 2008 parris@isciences.com http://www.isciences.comhttp://www.terraviva.net

2
Global Distribution of the Worlds Water Freshwater is precious! Freshwater is 2.5% of total ~30.5% of freshwater is renewable (non-fossil groundwater, surface water) Source: UNEP (2007). Global Environmental Outlook 4: Environment for development. Progress Press Ltd.: Malta
 Source: UNEP (2007). Global Environmental Outlook 4: Environment for development. Progress Press Ltd.: Malta.")
3
Terrestrial Hydrologic System Source: Falkenmark M, Lannerstad M (2005). Consumptive water use to feed humanity – curing a blind spot. Hydrology and Earth System Sciences 9:15-28.

4
Growing Demand for Freshwater Source: Shiklomanov IA (1998). Assessment of water resource and water availability in the world. Report for the Comprehensive Assessment of the Freshwater Resources of the World, United Nations. As reprinted in Gleick PG (2000). The Worlds Water 2000-2001. Island Press: Washington, DC.
. The Worlds Water Island Press: Washington, DC..")
5
Freshwater Withdrawals & Consumptive Use by Sector Source: Shiklomanov IA (1998). Assessment of water resource and water availability in the world. Report for the Comprehensive Assessment of the Freshwater Resources of the World, United Nations. As reprinted in Gleick PG (2000). The Worlds Water 2000-2001. Island Press: Washington, DC.
. The Worlds Water Island Press: Washington, DC..")
6
Agriculture and Water In 35 years post WWII world agricultural production doubled by increasing: nitrogen fertilization by factor of 6.9 phosphorous fertilization by factor of 3.5 cropland under irrigation by factor of 1.7 Land under cultivation by 1.1 Source: Tilman D (1999). Global environmental impacts of agricultural expansion: The need for sustainable and efficient practices. Proceedings of the National Academy of Sciences of the United States of America 96:5995-6000 (May).
..")
7
Agriculture and Water (cont.) If the same methods are used, the next production doubling is optimistically estimated to require: 3x more nitrogen 3x more phosphorous 2x more irrigated land area 1.18 x more land under cultivation Source: Tilman D (1999). Global environmental impacts of agricultural expansion: The need for sustainable and efficient practices. Proceedings of the National Academy of Sciences of the United States of America 96:5995-6000 (May).
..")
8
Agriculture and Water (cont) The global agricultural enterprise is passing a threshold. It has gone from being a minor source of off-site environmental degradation 35 years ago to becoming the major source of nitrogen and phosphorus loading to terrestrial, freshwater, and marine ecosystems. If this loading increases as projected here, agriculture will adversely transform most of the remaining natural, nonagricultural ecosystems of the world. Because the global environmental impact of agriculture on natural ecosystems and the services they provide may be as serious a problem as global climate change, the impacts of agriculture merit more study. Source: Tilman D (1999). Global environmental impacts of agricultural expansion: The need for sustainable and efficient practices. Proceedings of the National Academy of Sciences of the United States of America 96:5995-6000 (May).
. Global environmental impacts of agricultural expansion: The need for sustainable and efficient practices. Proceedings of the National Academy of Sciences of the United States of America 96: (May)..")
9
Measuring Water Stress Water Availability per capita Water Withdrawal Ratio Water Reuse Index

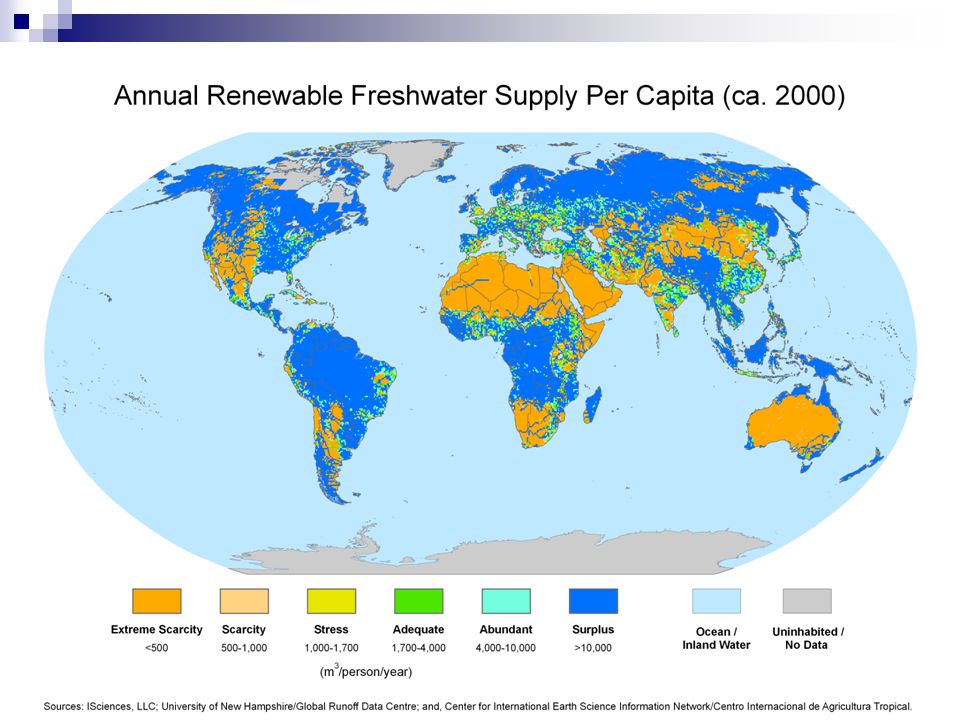
10
Analysis By Country Source: UN World Water Development Report: Water for People, Water for Life, UNESCO, 2003

11
Source: Pilot Analysis of Freshwater Ecosystems: Freshwater Systems, World Resources Institute, 2000

13
Water Withdrawal Ratio Source: Water Systems Analysis Group. Indicators for World Water Assessment Programme. http://wwdrii.sr.unh.edu/

14
Water Reuse Index Source: Water Systems Analysis Group. Indicators for World Water Assessment Programme. http://wwdrii.sr.unh.edu/

15
Corporate Social Responsibility Reporting Global reporting initiative (www.globalreporting.org) establishes standard metrics for corporate social responsibility reports Water metrics include Total water withdrawal by source Water sources significantly affected by withdrawal of water Percentage and total volume of water recycled and reused Total water discharge by quality and destination Identify, size, protected status, and biodiversity value of water bodies and related habitats significantly affected by discharges of water and runoff

16
Global Water Tool World Business Council on Sustainable Development (WBCSD) http://www.wbcsd.org/web/watertool.htm http://www.wbcsd.org/web/watertool.htm Excel-based spreadsheet to help companies produce GRI water related metrics Accounting Map lookups access to improved water (country-by-country), access to improved sanitation (country-by-country), annual renewable water supply per person 1995 (major watershed-by-major watershed), annual renewable water supply per person 2025 (major watershed-by-major watershed), Water withdrawal ratio (0.5° x 0.5° grid cells), or the Ratio of industrial to total water use (0.5° x 0.5° grid cells).
 Excel-based spreadsheet to help companies produce GRI water related metrics Accounting Map lookups access to improved water (country-by-country), access to improved sanitation (country-by-country), annual renewable water supply per person 1995 (major watershed-by-major watershed), annual renewable water supply per person 2025 (major watershed-by-major watershed), Water withdrawal ratio (0.5° x 0.5° grid cells), or the Ratio of industrial to total water use (0.5° x 0.5° grid cells).")
17
Time Horizon Chronic Conditions Expected conditions using current climate and typical use Episodic Conditions Todays conditions using current weather and todays use Long-Term Conditions Future chronic conditions using scenarios of future climate and future use Frequencies of future episodic conditions using scenarios of future climate and future use

18
Types of Drought Meteorological droughts occur when precipitation and temperature depart significantly from norms derived from long-term observations Hydrologic droughts occur when accessible blue water and subsurface supplies depart significantly from long-term norms derived from long-term observations. Hydrologic drought addresses changes precipitation in the context of hydrologic transfers through rivers, lakes, subsurface geology, and other inland aquatic systems. Agricultural droughts occur when accessible blue water and subsurface supplies are insufficient to support normal rain fed crop or rangeland production Socio-economic droughts occur when accessible blue water and subsurface supplies are insufficient to support normal freshwater withdrawals in aggregate

19
Global Drought Monitor 12 Month Precipitation Drought (April 2008)12 Month Soil Moisture Drought (April 2008) Source: Global Drought Monitor, http://drought.mssl.ucl.ac.uk/
12 Month Soil Moisture Drought (April 2008) Source: Global Drought Monitor,")
20
Selected GCM Runoff Estimates (1989-1999) GISS AOM 4x3 CCSM3 CM 2.1 UNH/GDRC Composite Fields Sources: ISciences, Goddard Institute of Space Science (NASA)Sources: ISciences, National Center for Atmospheric Research (NCAR) Sources: ISciences, Geophysical Fluid Dynamics Laboratory (NOAA) Sources: ISciences, University of New Hampshire - Global Runoff Data Center
 GISS AOM 4x3 CCSM3 CM 2.1 UNH/GDRC Composite Fields Sources: ISciences, Goddard Institute of Space Science (NASA)Sources: ISciences, National Center for Atmospheric Research (NCAR) Sources: ISciences, Geophysical Fluid Dynamics Laboratory (NOAA) Sources: ISciences, University of New Hampshire - Global Runoff Data Center")
Similar presentations


 Assessments Ton Bresser National Institute of Public Health and Environment Frans.>")


. Distribution on Earth “Water, water everywhere, nor any drop to drink.” – Coleridge, Rime of the Ancient Mariner.>")

 Water Resources (from IPCC WG-2, Chapter 3) Water Resources Primary Source: IPCC WG-2 Chapter 3 – Freshwater.>")
