Download presentation
Presentation is loading. Please wait.

1
Illinois Water Resources

2
Illinois Water Usage Data from A Plan for Scientific Assessment of Water Supplies in Illinois, ISWS,2001 20 billion gallons per day (bgd) used for domestic, municipal, commercial, agricultural, mining, power generation, recreation, navigation, and waste dilution purposes. Use does not include water required for sustainment of healthy ecosystems

3
Distribution of Water Sources

5
Estimated Potential Yields of Fresh Water Sources of water Lake Michigan – 1350 Mgd Shallow Aquifers – 200 Mgd Deep Aquifers – 60 Mgd Rivers Fox River – 50 Mgd Kankakee River – 130 Mgd Streams Lakes Reservoirs The amount or quantity of water that exists in Illinois depends on four factors: water availability water demand supply from existing delivery systems actual use.

6
Statewide, about 25 percent of the precipitation runs off the land surface or infiltrates the soil in an average year. Statewide, about 75 percent of precipitation is returned to the atmosphere through evapotranspiration in an average year. During droughts, this percentage approaches 100 percent, leaving little precipitation for runoff or aquifer recharge. The amount of water that runs off the land surface or percolates into the soil also is influenced by temperature, the nature of the land cover, and drainage systems. Recharge

8
Describe the distribution of surface water withdrawal? How do they correspond to population centers in the state? Surface water Use

9
Available Water? Conversions: 1 gal = 0.134 ft 3 1 ft 3 =7.48 gal 1 gal per day (gpd) = 1.55 * 10 -6 ft 3 per second (cfs) 1 cfs = ~646,000 gpd How do these values compare to use?
 = 1.55 * ft 3 per second (cfs) 1 cfs = ~646,000 gpd How do these values compare to use .")
10
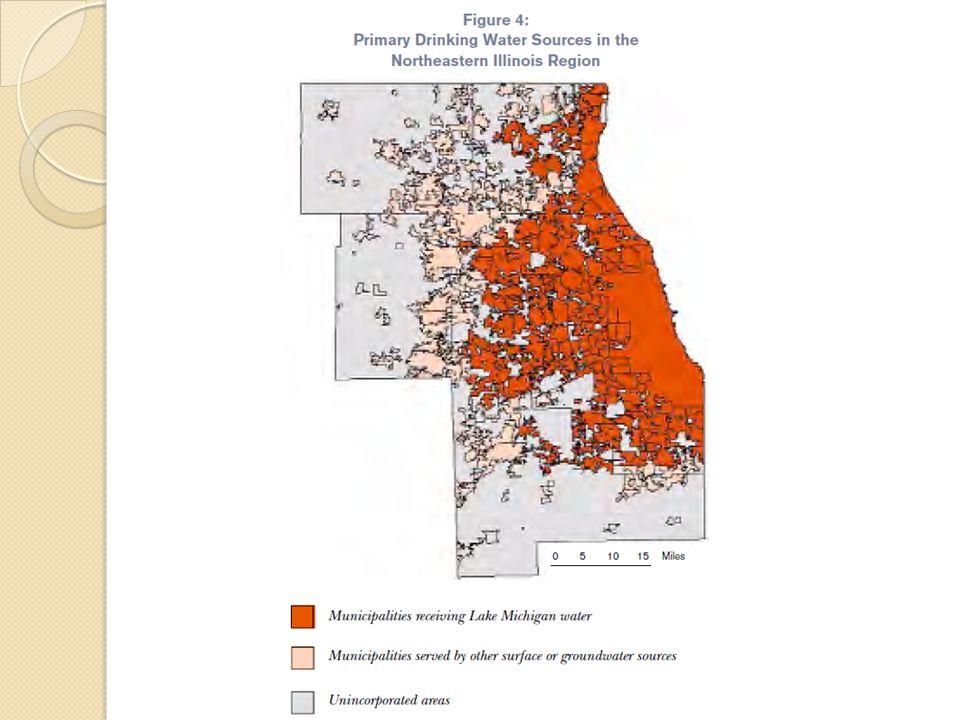
Reliance on Surface Waters About two-thirds of the water supplies in Illinois are from lakes, rivers, streams, and reservoirs. In southern Illinois, where groundwater resources are not very abundant, there is heavy reliance on surface waters. Surface waters are the source of most public water supplies in southern and central Illinois, both from direct withdrawals from streams and, more commonly, through reservoirs formed by stream impoundment. Lake Michigan 201public water supply systems serving approximately 6.8 million northeastern Illinois residents have a permit to use Lake Michigan water NE Illinois, about 2 Bgd are withdrawn Withdrawal of water from Lake Michigan is set by decree of the United States Supreme Court and by agreement with other states and Canada. The allocation is almost fully used and is unlikely to be increased in the near future. Lake Michigan Diversion U.S. Supreme Court decrees limit Illinois to diverting an average of 3,200 cubic feet per second (cfs) from Lake Michigan. Illinois exceeded this limit during 11 of the 15 years from 1981 through 1995; the State diversion averaged 3,197 cfs during 1995. Essentially, Lake Michigan water is already fully allocated.
 from Lake Michigan. Illinois exceeded this limit during 11 of the 15 years from 1981 through 1995; the State diversion averaged 3,197 cfs during Essentially, Lake Michigan water is already fully allocated..")
12
Groundwater Use Groundwater is withdrawn for large public, industrial, and commercial purposes average about 1 billion gallons per day and serve about a third of Illinois population. Three principal categories of aquifers in Illinois (1) unconsolidated sand-and-gravel aquifers contained within the glacial drift (2) shallow bedrock aquifers (3) deep bedrock aquifers. Thousands of private wells tap water in the shallow aquifers. Many factors influence the practical renewable yield of aquifers and water quality, High-capacity wells also may have adverse impacts on nearby wells and the base flows of rivers and streams, regardless of whether or not the practical renewable yield of the source aquifer is exceeded.
 unconsolidated sand-and-gravel aquifers contained within the glacial drift (2) shallow bedrock aquifers (3) deep bedrock aquifers. Thousands of private wells tap water in the shallow aquifers. Many factors influence the practical renewable yield of aquifers and water quality, High-capacity wells also may have adverse impacts on nearby wells and the base flows of rivers and streams, regardless of whether or not the practical renewable yield of the source aquifer is exceeded..")
13
Practical Renewable Yield What is it? Practical renewable yield: The maximum amount of water that can be continuously withdrawn from a water source without exceeding recharge or causing water levels to decline below critical levels. Sustained Yield – alternate terminology, Maximum amount of water that can be continuously withdrawn from existing pumping centers without detwatering the most productive water yielding formation. Safe yield - The attainment and maintenance of a long-term balance between the amount of ground water withdrawn annually and the annual amount of recharge Problems with either definition?

14
Major Aquifers of Illinois Cambrian-Ordovician System (deep bedrock) – aquifer system of NE Illinois The Mahomet aquifer of east-central Illinois from Indiana to the Illinois River The shallow sand-and-gravel and bedrock aquifers in northeastern Illinois The Sankoty aquifer of Lee and Whiteside Counties and from Hennepin to Washington The shallow dolomite in Kankakee, Iroquois, Will, and Cook Counties The Saline Valley in Saline and Gallatin Counties Alluvial aquifer systems Mississippi River Wabash River Valley Lower Illinois River from Beardstown to Alton Rock River from Wisconsin to Sterling Kaskaskia River Valley Cache River Valley Embarras River Valley
 – aquifer system of NE Illinois The Mahomet aquifer of east-central Illinois from Indiana to the Illinois River The shallow sand-and-gravel and bedrock aquifers in northeastern Illinois The Sankoty aquifer of Lee and Whiteside Counties and from Hennepin to Washington The shallow dolomite in Kankakee, Iroquois, Will, and Cook Counties The Saline Valley in Saline and Gallatin Counties Alluvial aquifer systems Mississippi River Wabash River Valley Lower Illinois River from Beardstown to Alton Rock River from Wisconsin to Sterling Kaskaskia River Valley Cache River Valley Embarras River Valley")
15
Bedrock Aquifers - Deep

16
Bedrock Aquifer - Shallow

17
Sand & Gravel Aquifers - Shallow

18
Shallow Aquifers

19
Cambrian-Ordovician System Most highly developed aquifer in northern Illinois. System is confined and under artesian pressure where it has not been over utilized. Complex multiaquifer system with individual aquifers separated by leaky confining units. Capped by the Maquoketa confining unit, which confines them as an aquifer system. Water transmitted primarily through intergranular porosity

22
Hydrogeology of C-O Aquifer Average T = 17,000 gpd/ft Estimated sustained yield – 46-65 Mgd Average well yield - > 700 gpm UnitK (gpd/ft 2 )Thickness (ft) St. Peter3075-650 Galena-Platteville13150-350 Ironton-Galesville10100-300 Mt. Simon1002000+

23
Ground-water flow is to the south, east, and west, away from a ground- water divide. Recharge to the Cambrian-Ordovician aquifer occurs in north- central and northwest Illinois. The recharge area corresponds to that part of northern Illinois where the shale deposits of the Maquoketa Group and the Devonian, Mississippian, or Pennsylvanian System have been removed by erosion and the deposits of the Cambrian- Ordovician aquifer are at the bedrock surface.

24
Water Quality Unconfined area (Maquoketa absent) Ca-Mg-HCO 3 type, TDS < 400 mg/L Confined area (Maquoketa present) Evolution to Na-SO 4 -Cl type, TDS > 500 mg/L SO 4 - from evaporative deposits beneath Lake Michigan (how does this fit with flow?) Mt. Simon – not used TDS too high Used for gas storage

25
Stress on Cambrian-Ordovician System 1864 – oil exploration encountered fresh artesian groundwater, initial head 80 ft above land surface, flowing at 150 gpm 1900 – wells producing 23 Mgd from system As the industry and population grew in the Chicago region, withdrawals exceeded the region's for the Cambrian-Ordovician aquifer system. 1979 - pumpage from this deep bedrock aquifer in the eight-county area in northeastern Illinois reached an all-time high of 182.9 mgd, nearly triple the estimated sustained yield of the aquifer system 1980 - continued heavy pumpage had caused the potentiometric level of the deep bedrock aquifers at Chicago to decline more than 850 feet. Until Lake Michigan water became available to the collar counties in the early 1980s, pumpage in excess of the sustained yield had occurred every year since the late 1950s. Wisconsin sues, artifical gradient drawing a modled 9 Mgd from Wisconsin to Illinois Withdrawals from the deep bedrock aquifers are currently very near the estimated sustainable yield. As a result of Lake Michigan diversions and consequent reductions in withdrawals from the deep bedrock, recovery of water levels has been observed in some areas. The Cambrian-Ordovician aquifer system is under stress from extensive ground-water withdrawals in southeastern Wisconsin, much of Iowa, and especially in the Chicago, Illinois area in the adjoining Segment 10. In all but the deeply buried parts of the aquifer system, the water is chemically suitable for all uses.

26
Water naturally polluted Arsenic, radium, suspended sediment, and chloride Anthropogenic pollutants Pesticides, metals, nutrients, sediments, and organic compounds

28
TDS in Deep Aquifers

29
Mahomet Aquifer Most important aquifer in east-central Illinois. Non Ag Use estimated at +30 mgd. Irrigation puts usage well over 100 mgd Part of the buried Mahomet Bedrock Valley. Underlies 15 counties.

30
Mahomet Aquifer

31
Hydrogeologic setting-Mahomet Aquifer Sand and gravel deposited by glacial meltwater flowing westward along the Mahomet Bedrock Valley during the pre-Illinois glacial episode. western part of the Teays-Mahomet Bedrock Valley System that extends into Illinois from Indiana and can be found into West Virginia. The Mahomet 4 to 15 miles wide (6 to 24 km) 50 to 200 feet (15 to 60 m) thick, average thickness is 100 feet (30 m). Confined except in Mason, Menard, and Tazewell Counties in the west near the Illinois River.
 50 to 200 feet (15 to 60 m) thick, average thickness is 100 feet (30 m). Confined except in Mason, Menard, and Tazewell Counties in the west near the Illinois River..")
32
Mahomet Aquifer

33
Groundwater use-Mahomet Aquifer The Mahomet Aquifer supplies approximately 850,000 people with water. An estimated 100,000,000 US gallons (380,000 m 3 ) per day is pumped from the aquifer. Approximately 45% of the water withdrawn is consumed by the public, 29% by industry, and 18% by commercial users. The remaining percentage is for other uses such as livestock and irrigation.
 per day is pumped from the aquifer. Approximately 45% of the water withdrawn is consumed by the public, 29% by industry, and 18% by commercial users. The remaining percentage is for other uses such as livestock and irrigation..")
34
Mahomet Stresses A long-term hydrograph at Champaign shows a decline in artesian head of nearly 50 feet since 1950, as a result of increasing water demand in the Champaign-Urbana area. The elevation of the top of the aquifer in this region is at approximately 525 feet, so additional development of the aquifer can continue in the Champaign area for quite some time. Similar, perhaps greater, declines can be expected in other areas of development as use of the aquifer increases. Increasing Demands Population projections suggest that by 2020, the Mahomet aquifer region may increase by 100,000 people to a total of 900,000. Additional demands for water may result as several central Illinois communities currently using surface water reservoirs look to the Mahomet to alleviate reservoir capacity and water quality problems. The additional demands of Springfield, Decatur, Bloomington, and Danville could potentially increase groundwater demands on the Mahomet aquifer by 80 mgd. Groundwater Quality Water generally of excellent quality areas of high ammonia and total organic carbon Arsenic approaching or even exceeding drinking standards. elevated concentrations of dissolved minerals, possibly as a result of upwelling from the underlying bedrock. potential for agricultural chemical and nutrient contamination in areas where unconfined(Mason and Tazewell Counties). Science for Water Resources Management While the sustained yield of the Mahomet aquifer has been estimated to be in excess of 400 mgd, over-development of the aquifer can occur in localized areas.
. Science for Water Resources Management While the sustained yield of the Mahomet aquifer has been estimated to be in excess of 400 mgd, over-development of the aquifer can occur in localized areas..")
35
Water quality-Mahomet Aquifer The water is high in dissolved minerals and iron. Concern is the naturally occurring arsenic. The arsenic leaches from oxidized-pyrite. Concentrations can range from 20 to 70 parts per billion (ppb) which exceeds the standard of 10 ppb adopted by the U.S. Environmental Protection Agency.
 which exceeds the standard of 10 ppb adopted by the U.S. Environmental Protection Agency..")
36
Predicted Water Availability

37
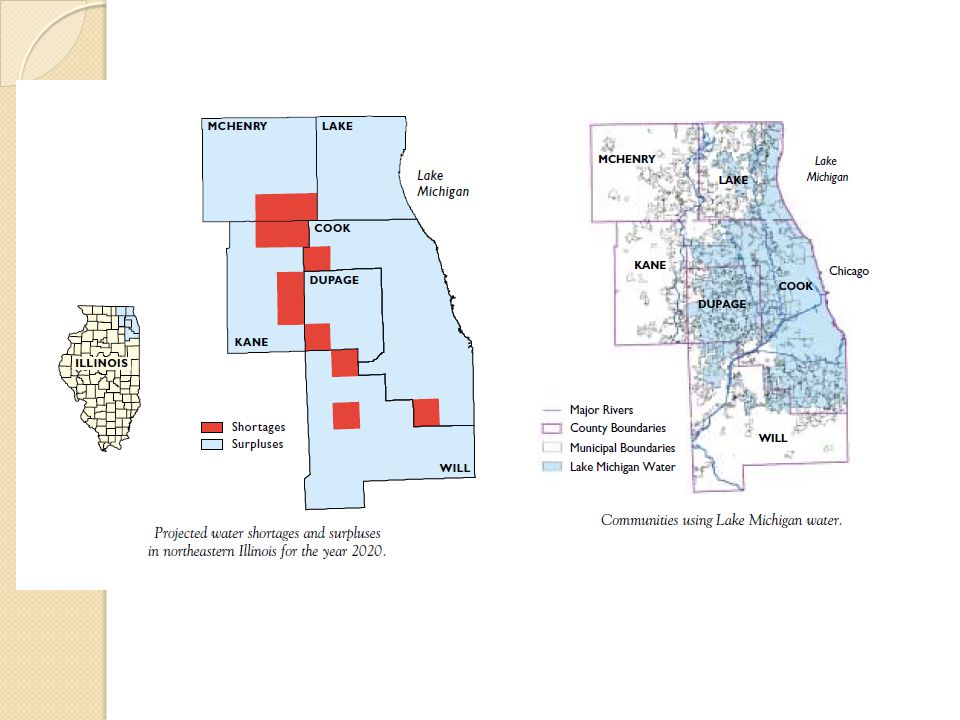
Projected Water Needs Demand for water is increasing in many parts of the state, primarily as a result of growth in the population and the economy. Population in the Chicago metropolitan area is projected to grow by about one million by 2020 The demand for water in some parts of the state already exceeds or soon will exceed practical renewable yields, for example, from the deep bedrock aquifer of northeastern Illinois. Water levels in some central Illinois reservoirs were reduced to critical levels in the moderate 1999–2000 drought. Researchers from Southern Illinois Universitys Department of Geography report water use statewide is projected to increase almost 28 percent overall by 2025. Water use will increase in 89 of 102 counties. Even under normal climatic conditions, NIPC projects water shortages for 11 townships in the Chicago metropolitan area by 2020 State laws permit reasonable use of water resources, but the courts often determine what is reasonable and resolve conflicts. Water withdrawals typically are not evaluated based on cumulative impacts or renewable yields. The deep aquifer system and Lake Michigan are now at or near their sustainable or legally mandated limits and cannot be relied upon as significant sources of additional water for the region.

Similar presentations