Download presentation
Presentation is loading. Please wait.

1
REPRESENTACION GRAFICA DE CONDICIONES CLINICAS EN LAS CURVAS DE MONITOREO VENTILATORIO

2
Air Leak Inspiration Expiration Volume (ml) Flow(L/min) Air Leak in mL Normal Abnormal
 Flow(L/min) Air Leak in mL Normal Abnormal")
3
Air Trapping Inspiration Expiration Volume (ml) Flow (L/min) Does not return to baseline Normal Abnormal
 Flow (L/min) Does not return to baseline Normal Abnormal")
4
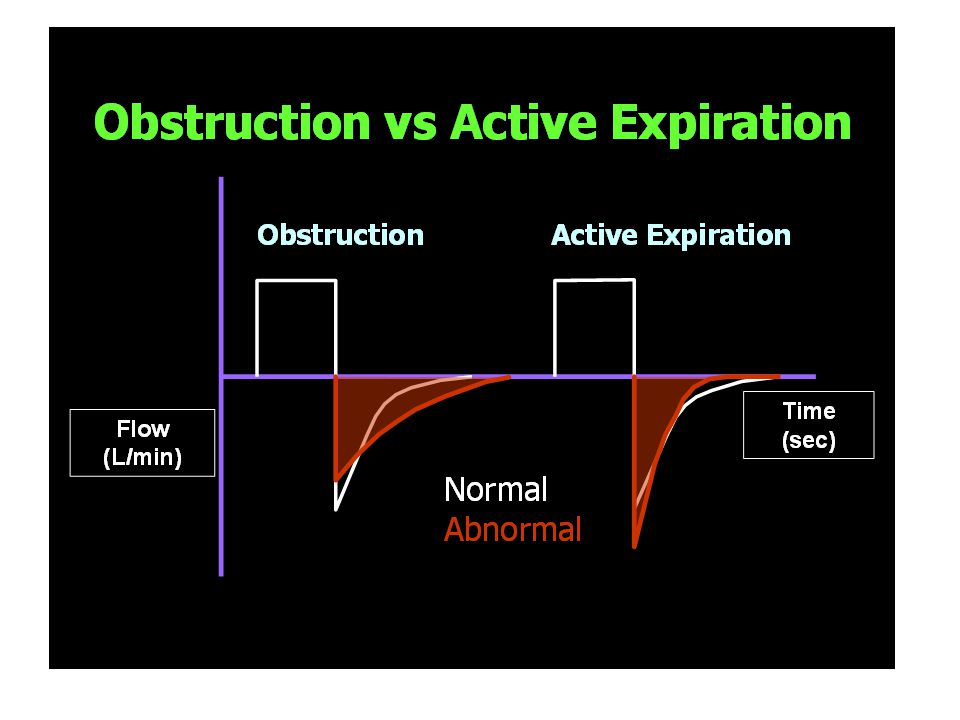
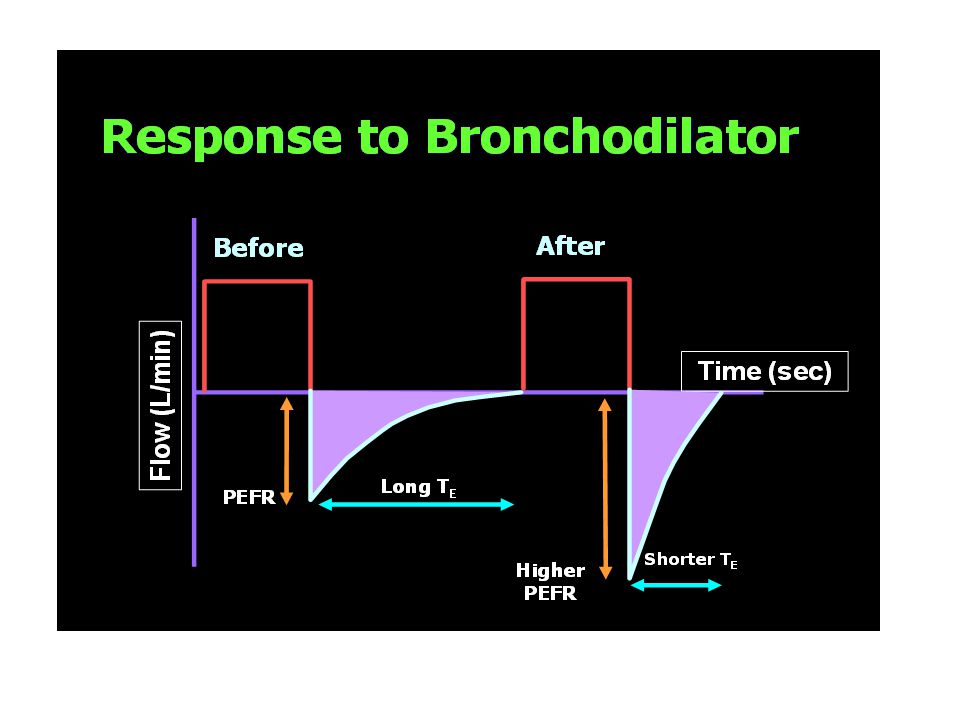
Increased Airway Resistance Inspiration Expiration Volume (ml) Flow (L/min) Decreased PEFR Normal Abnormal Scooped out pattern Scooped out pattern
 Flow (L/min) Decreased PEFR Normal Abnormal Scooped out pattern Scooped out pattern")
5
Flow-Volume Loop Volume (ml) PEFR FRC Inspiration Expiration Flow (L/min) PIFR VTVT
 PEFR FRC Inspiration Expiration Flow (L/min) PIFR VTVT")
6
Airway Secretions/ Water in the Circuit Inspiration Expiration Volume (ml) Flow (L/min) NormalAbnormal
 Flow (L/min) NormalAbnormal")
7
Air Trapping Inspiration ExpirationNormalPatient Time (sec) Flow (L/min) Air Trapping Auto-PEEP }
 Flow (L/min) Air Trapping Auto-PEEP }")
10
Flow Patterns ACCELERATING DECELERATING SINE SQUARE

11
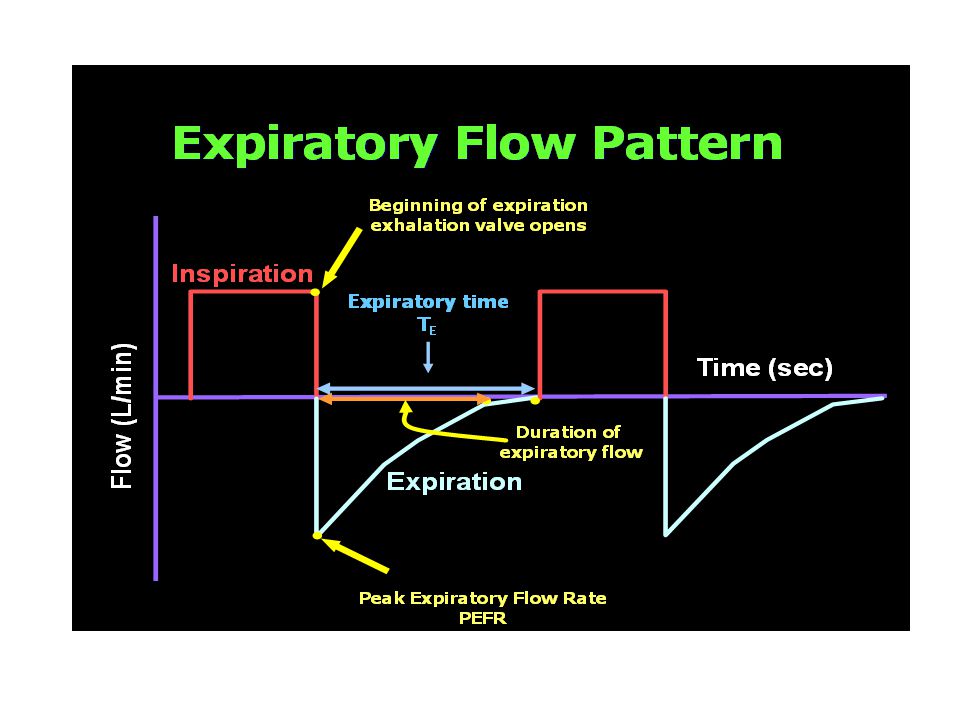
Inspiratory Flow Pattern Inspiration Expiration Time (sec) Flow (L/min) Beginning of inspiration exhalation valve closes Peak inspiratory flow rate PIFR Beginning of expiration exhalation valve opens Total cycle time TCT Inspiratory Time T I Expiratory Time T E
 Flow (L/min) Beginning of inspiration exhalation valve closes Peak inspiratory flow rate PIFR Beginning of expiration exhalation valve opens Total cycle time TCT Inspiratory Time T I Expiratory Time T E")
16
Assisted Mode (Pressure-Targeted Ventilation) Pressure Flow Volume (L/min) (cm H 2 O) (ml) Set PC level Time (sec) Time-Cycled Patient Triggered, Pressure Limited, Time Cycled Ventilation
 Pressure Flow Volume (L/min) (cm H 2 O) (ml) Set PC level Time (sec) Time-Cycled Patient Triggered, Pressure Limited, Time Cycled Ventilation")
17
Assisted Mode (Volume-Targeted Ventilation) Time (sec) Flow (L/m) Pressure (cm H 2 O) Volume (mL) Preset V T Volume Cycling Patient triggered, Flow limited, Volume cycled Ventilation
 Time (sec) Flow (L/m) Pressure (cm H 2 O) Volume (mL) Preset V T Volume Cycling Patient triggered, Flow limited, Volume cycled Ventilation")
18
Controlled Mode (Pressure- Targeted Ventilation) Pressure Flow Volume (L/min) (cm H 2 O) (ml) Time (sec) Time- Time-CycledSet PC level Time Triggered, Pressure Limited, Time Cycled Ventilation
 Pressure Flow Volume (L/min) (cm H 2 O) (ml) Time (sec) Time- Time-CycledSet PC level Time Triggered, Pressure Limited, Time Cycled Ventilation")
19
Controlled Mode (Volume-Targeted Ventilation) Preset V T Volume Cycling Dependent on C L & R aw Time (sec) Flow (L/m) Pressure (cm H 2 O) Volume (mL) Preset Peak Flow Time triggered, Flow limited, Volume cycled Ventilation
 Preset V T Volume Cycling Dependent on C L & R aw Time (sec) Flow (L/m) Pressure (cm H 2 O) Volume (mL) Preset Peak Flow Time triggered, Flow limited, Volume cycled Ventilation")
20
CPAP Time (sec) CPAP level Flow (L/m) Pressure (cm H 2 O) Volume (mL)
 CPAP level Flow (L/m) Pressure (cm H 2 O) Volume (mL)")
21
CPAP + PSV Set PS level CPAP level Time (sec) Flow (L/m) Pressure (cm H 2 O) Volume (mL) Flow Cycling
 Flow (L/m) Pressure (cm H 2 O) Volume (mL) Flow Cycling")
22
Modes of Ventilation on Scalar Graphics FLOW PRESSURE VOLUME

23
Spontaneous Breath Flow Pressure Volume Time (sec) (ml) (cm H 2 O) (L/min)
 (ml) (cm H 2 O) (L/min)")
24
CPAP Flow Pressure Volume 0 5 Time (sec) (L/min) (cm H 2 O) (ml)
 (L/min) (cm H 2 O) (ml)")
25
SIMV/PS Flow Pressure Volume Time (sec) (L/min) (cm H 2 O) (ml) Set PS level
 (L/min) (cm H 2 O) (ml) Set PS level")
26
Volume Ventilation Pressure Volume Volume Flow Preset Peak Flow Preset V t Dependent on C l & R aw Time (sec) (L/min) (cm H 2 O) (ml)
 (L/min) (cm H 2 O) (ml)")
27
Pressure Control Ventilation Flow Pressure Volume ClClClCl ClClClCl Set PC level Time (sec) (L/min) (cm H 2 O) (ml)
 (L/min) (cm H 2 O) (ml)")
28
Assist Control Flow Pressure Volume Time (sec) (L/min) (cm H 2 O) (ml)
 (L/min) (cm H 2 O) (ml)")
29
CMV Flow Pressure Volume Time (sec) (L/min) (cm H 2 O) (ml)
 (L/min) (cm H 2 O) (ml)")
30
I M V Flow Pressure Volume Time (sec) (L/min) (cm H 2 O) (ml)
 (L/min) (cm H 2 O) (ml)")
31
PSV Time (sec) Flow (L/m) Pressure (cm H 2 O) Volume (mL) Flow Cycling Set PS level Patient Triggered, Flow Cycled, Pressure limited Mode
 Flow (L/m) Pressure (cm H 2 O) Volume (mL) Flow Cycling Set PS level Patient Triggered, Flow Cycled, Pressure limited Mode")
32
Pressure Flow Volume (L/min) (cm H 2 O) (ml) Set PC level Time (sec) SIMV Mode (Pressure-Targeted Ventilation) Spontaneous Breath
 (cm H 2 O) (ml) Set PC level Time (sec) SIMV Mode (Pressure-Targeted Ventilation) Spontaneous Breath")
33
SIMV (Volume-Targeted Ventilation) Spontaneous Breaths Flow (L/m) Pressure (cm H 2 O) Volume (mL)
 Spontaneous Breaths Flow (L/m) Pressure (cm H 2 O) Volume (mL)")
34
Pressure Flow Volume (L/min) (cm H 2 O) (ml) SIMV + PS (Pressure-Targeted Ventilation) PS Breath Set PS level Set PC level Time (sec) Time-Cycled Flow-Cycled
 (cm H 2 O) (ml) SIMV + PS (Pressure-Targeted Ventilation) PS Breath Set PS level Set PC level Time (sec) Time-Cycled Flow-Cycled")
35
SIMV+PS (Volume-Targeted Ventilation) Flow Pressure Volume (L/min) (cm H 2 O) (ml) Set PS level PS Breath Flow-cycled
 Flow Pressure Volume (L/min) (cm H 2 O) (ml) Set PS level PS Breath Flow-cycled")
36
Pressure Flow Volume (L/min) (cm H 2 O) (ml) Set PC level Time (sec) SIMV + PS + CPAP (Pressure-Targeted Ventilation) Set PS level CPAP level
 (cm H 2 O) (ml) Set PC level Time (sec) SIMV + PS + CPAP (Pressure-Targeted Ventilation) Set PS level CPAP level")
37
SIMV+PS + CPAP (Volume-Targeted Ventilation) Flow Pressure Volume (L/min) (cm H 2 O) (ml) Set PS level CPAP level
 Flow Pressure Volume (L/min) (cm H 2 O) (ml) Set PS level CPAP level")
38
Spontaneous Breath Time (sec) Flow (L/m) Pressure (cm H 2 O) Volume (mL)
 Flow (L/m) Pressure (cm H 2 O) Volume (mL)")
Similar presentations