Download presentation
Presentation is loading. Please wait.

1
Chapter 2 - Mapping Our World
Section 1: Latitude and Longitude Section 2: Types of Maps Section 3: Remote Sensing

2
Section 1: Lines of latitude and longitude are used to locate places on Earth.
Section 2: Maps are flat projections that come in many different forms. Section 3: New technologies have changed the appearance and use of maps.

3
Section 1 – Latitude and Longitude
Maps are flat models of 3-dimensional objects. Cartography – the science of mapmaking. Cartographers use an imaginary grid of parallel lines to locate exact points on Earth. Equator – horizontally circles the Earth between the North and South poles. This splits the Earth into the Northern and Southern hemisphere.

4
Section 1 - Essential Questions
What is the difference between latitude and longitude? Why is it important to give a city’s complete coordinates when describing its location? Why are there different time zones from one geographic area to the next?

5
Latitude Latitude – lines on a map running parallel to the equator.
“Latitude = Flatitude” Latitude is measured in degrees North and South of the equator. The equator is 0˚. The North and South poles are labeled 90˚N and 90˚S

6
Locations North of the Equator are referred to degrees north latitude (N) and locations South are referred to as south latitude (S).
 and locations South are referred to as south latitude (S).")
7
Each degree of latitude is about 111 km (diameter of Earth – km divided by degrees of a sphere - 360°). To be more precise the degrees are broken down into 60 smaller units called minutes (‘). The minutes are broken down into 60 smaller units called seconds (‘’).
. The minutes are broken down into 60 smaller units called seconds (‘’).")
8
East Setauket is located at 40°55'32'' N

9
Longitude To find a positions in east and west directions cartographers use lines of longitude. Longitude is the distance in degrees east and west of the prime meridian. Prime Meridian represents 0° longitude. The prime meridian passes through Greenwich, England the home of the Royal Naval Observatory.

10
Points east and west of the prime meridian are numbered 0° to 180° west (W) and east (E).
 and east (E).")
11
Lines of longitude are not parallel but parts of a semicircle.
Each 15° line of longitude is equal to 1 hour of rotation. For example, if the sun is directly overhead, in one hour the Earth will move exactly 15°; in one day the Earth will move; in 24 hours the sun will move 360° and be where it started (24x15=360).
.")
12
On the globe opposite the Prime Meridian is the International Date Line (180˚).
The imaginary line runs through the middle of the Pacific Ocean. If you travel west across the International Date Line you would gain a day. If traveling east, you would lose a day. Latitude is always listed first when writing a location.

14
Section 2 – Types of Maps Essential Questions:
What are the similarities and differences betwenn different types of maps? Why are different maps uses for different purposes? How are gradients on a topographic map calculate?

15
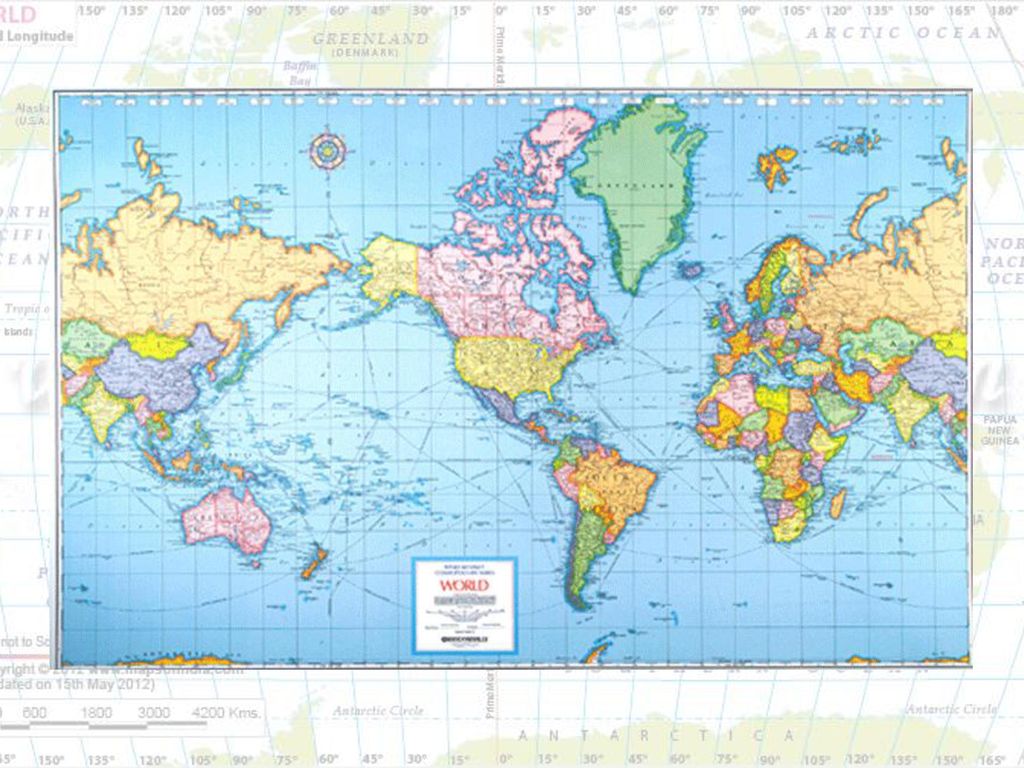
Projections Because Earth is spherical projections are used to transfer points onto a map. Mercator projection is a map that has parallel lines of latitude and longitude. A Mercator map correctly shows the landmasses but their size id distorted.

17
The map shows Greenland bigger than Australia which it is not because it distorts landmasses near the poles. Mercator maps are commonly used for navigation because it accurately shows longitude and latitude.

18
Conic Projections Conic projections are made by projecting points and lines from a globe onto a paper cone. Conic maps are excellent for mapping small areas because they have a high degree of accuracy.

20
Genomic Projections Genomic projections are made by projecting points and lines from a globe onto a piece of paper that touches the globe. The further away from the point the more distorted the map is.

22
Topographic Maps Topographic maps are detailed maps that show changes in elevation of Earth’s surface. They also show mountains, rivers, forests, and bridges. They use lines to represent changes in elevation. Contour lines represent points of equal elevation.

23
Elevation is above or below sea level.
Contour lines NEVER cross. Contour intervals is the difference in elevation of 2 side-by-side lines. Contour lines that are close together mean that the contour interval is great. This means that the area is steep.

25
Index contours are some contour lines marked by elevation.
They help in determining elevation of a point. Depression contour lines show points that are lower than the surrounding area. The contour line has hachure marks. Gradient refers to the steepness of a slope. Gradient = change in elevation/distance between two points.

27
Geologic Maps Geologic map is used to show the distribution, arrangement, and types of rocks located below the soil. Geologists can infer what rocks look like below the surface. The maps will also show fault lines, bedrock, and geologic formations. The maps are coded to show the type of rock.

28
Earth Science Reference Table – Page 3

29
Map Legends Map legends explain what the symbols on a map means.
Map scale is the ratio between distances on a map and actual distances on the surfaces of Earth. There are verbal scales, graphic scales, and fractional scales.

30
Section 3 – Remote Sensing
Essential Questions: What are some of the different types of remote sensing? How are satellites and sonar used to map Earth’s surface and its oceans? What is the Global Positioning System and how does it work?

31
Landsat Satellites Remote sensing is the process of gathering data about the Earth using instruments on satellites, airplanes, or ships. Landsat satellites record reflected wavelengths of warmth, from Earth’s surface. They are often used to aid in natural disaster relief planning, study pollution, the movements of Earth’s plates, and the melting of glaciers and ice caps.

32
OSTM/Jason Satellites measure and map sea surface height.
High frequency signals are transmitted onto the ocean and reflected back to the satellite that calculates the time it takes.

33
Global Positioning System
Global Position System (GPS) is a satellite navigation system that allows users to locate their approximate position on Earth. There are 24 satellites orbiting the Earth. You need at least 3 satellites to “triangulate” your position. The more the more accurate is your GPS location. GPS aids in navigation.
 is a satellite navigation system that allows users to locate their approximate position on Earth. There are 24 satellites orbiting the Earth. You need at least 3 satellites to triangulate your position. The more the more accurate is your GPS location. GPS aids in navigation.")
34
The Geographic Information System
Geographic Information System (GIS) combines many of he types and styles of maps discussed. GIS maps used data gathered by researchers to track changes.
 combines many of he types and styles of maps discussed. GIS maps used data gathered by researchers to track changes.")
Similar presentations


.>")


