Download presentation
Presentation is loading. Please wait.

1
Table of Contents Energy Flow in Ecosystems Cycles of Matter
Biogeography Biomes Aquatic Ecosystems

2
Energy Roles Recall that a self-sustaining ecosystem has four characteristics: 1. A constant source of energy (usually the sun) 2. Transfer of energy into organic compounds (usually through photosynthesis) 3. Interactions between biotic factors (predator/prey, mutualism, commensalism) 4. Cycling of materials (water cycle, nitrogen cycle, oxygen/carbon dioxide cycle, nutrient cycle)
 3. Interactions between biotic factors. (predator/prey, mutualism, commensalism) 4. Cycling of materials (water cycle, nitrogen. cycle, oxygen/carbon dioxide cycle, nutrient cycle)")
3
Energy Roles In order for these four factors to be met, organisms within an ecosystem must fit into one of three roles: Decomposers Producers Consumers

4
Producers Producers —organisms that make (produce) their own food.
-Usually, producers use energy from the sun to turn water and carbon dioxide into sugar. -This process is called photosynthesis. -Producers include: Plants Algae Cyanobacteria

5
Consumers Consumers —organisms that get energy by feeding on other organisms. Three types: Herbivores —eat only plants Carnivores —eat only animals Omnivores —eat both plants and animals

6
Click the Video button to watch a movie about consumers.
- Energy Flow in Ecosystems Consumers Click the Video button to watch a movie about consumers.

7
Decomposers Decomposers —break down wastes and dead organisms and return raw materials to the ecosystem. Decomposers include mostly bacteria and fungi such as mushrooms.

8
Food Chains and Food Webs
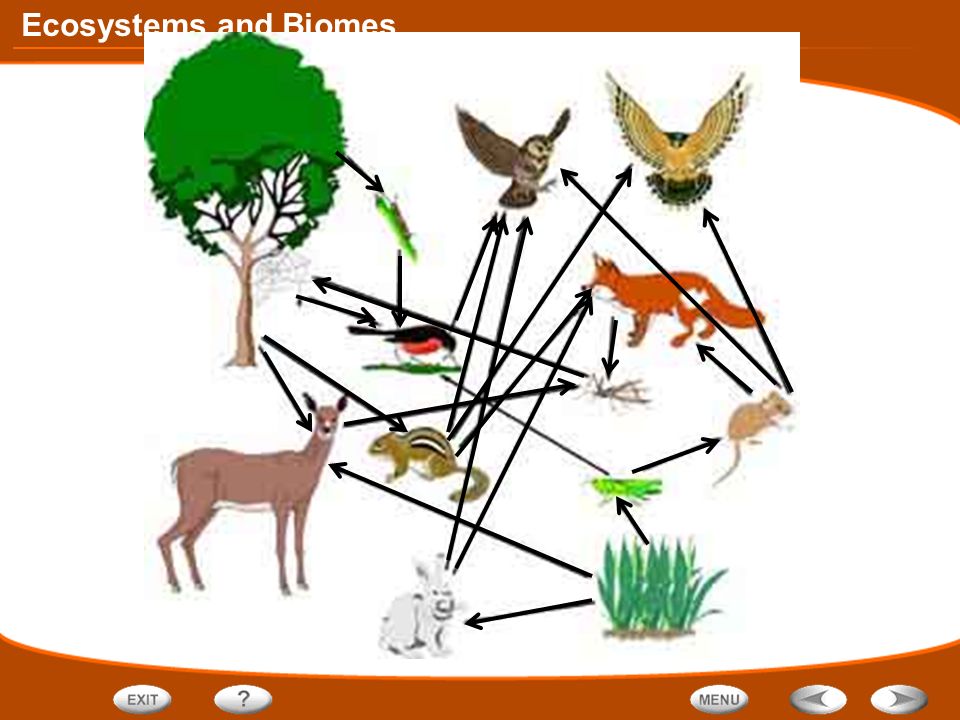
To sustain any ecosystem, energy must be transferred through the many organisms that live in the ecosystem. The movement of energy through an ecosystem can be shown in diagrams known as food chains and food webs. Food chain —shows a series of events in which one organism eats another and obtains energy. Food chains always start with a producer. Each organism that follows is known as a first, second, and third level consumers etc. Food chains show just one path of energy. C3 C2 C1

9
Food Webs Who is the only C5 consumer? Is there a C7? Food webs —show the many overlapping food chains in an ecosystem. In a food web, an organism can play more than one role. Can you find this food chain in the food web? Can you find an animal that is both a C2 and C3 consumer?

11
Food Chains and Food Webs
- Energy Flow in Ecosystems Food Chains and Food Webs The movement of energy though an ecosystem can be shown in diagrams called food chains and food webs.

12
Food chain/food web Flip chart

13
Energy Pyramids Energy Pyramids show the amount of energy that moves from one feeding level to another in a food web. The most amount of energy is available at the producer level. The amount of energy decreases at each level.

14
Only 10% of the energy available at one level is transferred to the next level.
The other 90% is used by the organism or lost to the environment in the form of heat. Therefore, each level can support fewer and fewer organisms.

15
Building Vocabulary - Energy Flow in Ecosystems
A definition states the meaning of a word or phrase by telling about its most important feature or function. After you read the section, reread the paragraphs that contain definitions of Key Terms. Use all the information you have learned to write a definition of each Key Term in your own words. Key Terms: Key Terms: Examples: energy pyramid food web producers Examples: food chain consumer herbivore omnivore carnivore scavenger An energy pyramid shows how much energy moves from one level to another in a food web, beginning with the producers. In a food chain, a consumer could be an herbivore, an omnivore, or a carnivore, including a scavenger. decomposer Decomposers are nature’s recyclers.

16
Links on Food Chains and Food Webs
- Energy Flow in Ecosystems Links on Food Chains and Food Webs Click the SciLinks button for links on food chains and food webs.

17
End of Section: Energy Flow in Ecosystems

18
Cycles of Matter Remember that one of the four characteristics of a self-sustaining ecosystem is the cycling of matter. This happens through three main processes: The Water Cycle—the process by which water moves from the Earth’s surface to the atmosphere and back. The Carbon/Oxygen Cycle—carbon dioxide and oxygen are recycled through processes that are linked together by producers and consumers. The Nitrogen Cycle—nitrogen cycles from the air, to the soil, into living things and back into the air.

19
The Water Cycle - Cycles of Matter
The processes of evaporation, condensation, and precipitation make up the water cycle.

20
Water Cycle Activity - Cycles of Matter
Click the Active Art button to open a browser window and access Active Art about the water cycle.

21
The Carbon and Oxygen Cycles
- Cycles of Matter The Carbon and Oxygen Cycles In ecosystems, the processes by which carbon and oxygen are recycled are linked. Producers, consumers, and decomposers play roles in recycling carbon and oxygen. What do you notice about the amounts of carbon dioxide and oxygen in this diagram?

22
The Nitrogen Cycle - Cycles of Matter
In the nitrogen cycle, nitrogen moves from the air to the soil, into living things, and back into the air.

23
Precipitation runs off or becomes groundwater.
- Cycles of Matter Sequencing Sequence is the order in which a series of events occurs. As you read, make a cycle diagram that shows the water cycle. Write each event of the water cycle in a separate oval. The Water Cycle Water evaporates. Precipitation runs off or becomes groundwater. Clouds form. Precipitation falls.

24
End of Section: Cycles of Matter

25
Biogeography Biogeography is the study of where organisms live.
From the Greek words: Bio = life Geo = earth Graph = description Biogeographers also try to figure out why they live there and how they got there. One factor that affects how species are spread out on the Earth is Continental Drift —the movement of the continents on top of large continental plates of rock.

26
Continental Drift 225 million years ago = all continents were joined together in one large land mass called Pangea. million years ago = Pangea broke into two large land masses known as Laurasia and Gondwanaland 135 million years ago = Laurasia and Gondwanaland begin to break apart into the seven continents seen today. They continue to drift apart every year.

27
Continental Drift - Biogeography
One factor that has affected how species are distributed is the motion of Earth’s continents.

28
Continental Drift Activity
- Biogeography Continental Drift Activity Click the Active Art button to open a browser window and access Active Art about continental drift.

29
Maps like this one (by Alfred Wegener, 1915) support the idea that the continents were once connected. They show how identical fossils of certain plants and animal that have been found on two sides of an ocean could have gotten there when the continents were joined.

30
Dispersal Dispersal —the movement of organisms from one place to another. It is caused by: Wind —disperses light weight organisms such as seeds, spores, tiny insects or spiders Water —disperses organisms that float such as coconuts, leaves or animals floating on them Other living things —many things are carried by other living things to new places—either accidentally or intentionally

31
Limits to Dispersal - Biogeography
The typical weather pattern in an area over a long period of time is the area’s climate.

32
Limits to Dispersal Three factors limit dispersal.
Physical barriers —water, mountains and deserts can be hard to cross. Competition —if one species out-compete another, the other must move somewhere else to survive. Climate —only certain species can survive in certain climates. This limits where they can disperse to. Places with similar climates have species that occupy similar niches.

33
Relating Cause and Effect
- Biogeography Relating Cause and Effect As you read, identify three causes of dispersal. Write the information in a graphic organizer like the one below. Causes Wind Effect Dispersal of species Water Living things, including humans

35
End of Section: Biogeography

36
Biomes Biome —a group of land ecosystems with similar
climates and organisms. Biomes are determined by their climate: meaning their and precipitation amounts and temperature. There are six major biomes in the world. rainforest deciduous forest desert boreal forest grassland tundra

37
Land Biomes and their Climates
Biome Ave. Yearly Rainfall Ave. Yearly Temp. Rainforest cm 25oC to 28oC Deserts less than 25 cm 24oC to 40oC Grasslands cm oC to 25oC Deciduous forest cm oC to 28oC Boreal forest cm oC to 14oC Tundra less than 25 cm -25oC to 4oC

38
Biome Map Rainforest Deciduous Forest Boreal Forest Grasslands Desert
Tundra

39
Rain Forest Biomes: Two Types
Tropical rain forests are wet, warm biomes located near the equator. They support more than ½ of all plant and animal species on the Earth.

40
Tropical Rainforests Characteristics:
Warm all year with at least 200 cm of rain/year Trees do not lose their leaves, creating a dense canopy that supports much of the animal life

41
Rain Forest Biomes - Biomes
Temperate rain forests receive 300 cm of rain and have moderate temperatures. They are located in northeast U.S. Huge cedars, redwoods and firs grow there.

42
- Biomes Desert Biomes A desert is an area that receives less than 25 cm of rain per year. Not all deserts are hot. Some are hot in the day and cold at night (Sahara, Africa). Others are cold all the time (Gobi, Mongolia).
. Others are cold all the time (Gobi, Mongolia).")
43
Grassland Biomes - Biomes
A grassland is an area that is populated mostly by grasses and other nonwoody plants. Grasslands close to the equator are called savannas. They have shrubs and trees along with grass. Most have fertile soil and grow good crops.

44
Deciduous Forest Biomes
Many of the trees in the deciduous forest are deciduous trees, which shed their leaves and grow new ones each year. A deciduous forest receives at least 50 cm of precipitation each year. Temperatures vary greatly through the year.

45
Click the Video button to watch a movie about deciduous forests.
- Biomes Deciduous Forests Click the Video button to watch a movie about deciduous forests.

46
Boreal Forest Biomes - Biomes
Most of the trees in the boreal forest are coniferous trees, trees that produce their seeds in cones and have leaves shaped like needles. Winters in the boreal forest are cold and very snowy, but summers are warm and rainy enough to melt all the snow. This biome is also know as the Taiga.

47
- Biomes Tundra The tundra is an extremely cold and dry biome. Most of the soil in the tundra is permafrost, which is frozen all year. Winters are long and cold with almost no daylight. Summers are short and cool with 24 hrs. of daylight.

48
Mountains and Ice - Biomes
Some areas of land are not part of any major biome. These areas include mountain ranges and land that is covered with thick sheets of ice.

49
Earth’s Biomes Activity
Click the Active Art button to open a browser window and access Active Art about Earth’s biomes.

50
Biome Climates - Biomes
An ecologist collected climate data from two locations. The graph shows the monthly average temperatures in the two locations. The total yearly precipitation in Location A is 250 cm. In Location B, the total yearly precipitation is 14 cm.

51
Biome Climates - Biomes Reading Graphs:
What variable is plotted on the horizontal axis? On the vertical axis? Month is plotted on the horizontal axis; temperature is plotted on the vertical axis.

52
Biome Climates - Biomes Interpreting Data:
Look over the graph. How would you describe the temperature over the course of a year in Location A? In Location B? Location A temperatures are steady; Location B temperatures fluctuate.

53
Biome Climates - Biomes Drawing Conclusions:
Given the precipitation and temperature data for these locations, in which biome would you expect each to be located? Explain your answers. Location A: tropical rain forest Location B: desert

54
Biome Climates - Biomes Predicting:
What would you expect a temperature graph for your biome to look like? Draw a temperature graph for the biome in which you live. Answers will vary but should reflect whether local climate is hot or cold, seasonal or steady.

55
Comparing and Contrasting
- Biomes Comparing and Contrasting As you read, compare and contrast the different biomes by completing a table like the one below. Tropical Rain Forest Temperate Rain Forest Character-istic Deciduous Forest Boreal Forest Tundra Desert Grassland Cool winters, warm in summer Usually hot with great daily extremes Temps vary throughout the year Warm in summer, cold in winter Warm to cool in summer, cold in winter Tempera-ture Warm all year Cold all year Mostly dry with a wet season Abundant rain and snow Precipit-ation Rather wet all year Moderate rainfall Wet all year Dry all year Dry all year Typical organisms Gamble’s quail Orangutan Mosses Mule deer Grasses Red fox Lynx

56
End of Section: Biomes

57
Aquatic Ecosystems Water covers 75% of Earth’s surface. There are two basic types of aquatic ecosystems: Freshwater Marine (saltwater)
")
58
Freshwater Ecosystems
Freshwater ecosystems can be divided into two major groups: Running water ecosystems —streams and rivers. Still water ecosystems —lakes and ponds.

59
Running Water Ecosystems
The amount of dissolved oxygen determines what organisms live in these ecosystems. Fast-moving streams or rivers are usually cool and therefore have a lot of dissolved oxygen. Little plankton is available so dead leaves and insect larva are important sources of food. Fish such as trout are common. Fast-moving stream

60
Running Water Ecosystems
In slow-moving streams or rivers, plankton is the base of the food-chain. Catfish and bass are common. Slow-moving stream

61
Still Water Ecosystems
Lakes and ponds make-up the still-water biomes. Algae and plankton are abundant and support the other animal life.

62
Marine Ecosystems - Aquatic Ecosystems
The ocean is home to a number of different ecosystems. Factors such as water temperature and the amount of sunlight determine what types of organisms can live in each zone.

63
Marine Ecosystems - Aquatic Ecosystems Open Ocean Zone—
Surface receives most sunlight: tuna, whales, algae. Deep Zone —little light passes: giant squid, glow in the dark animals Intertidal zone --Area between high-tide line and low-tide line. Barnacles, sea stars, crabs, clams etc. Neritic Zone – Area extending to the end of the continental shelf. Large schools of fish, algae, coral reef habitats

64
Outlining - Aquatic Ecosystems
As you read, make an outline about the different types of aquatic ecosystems. Use the red headings for the main ideas and the blue headings for the supporting ideas. Freshwater Ecosystems Streams and Rivers Ponds and Lakes Marine Ecosystems Intertidal Zone Neritic Zone Open Ocean

65
End of Section: Aquatic Ecosystems

66
Graphic Organizer Nitrogen Cycle Free nitrogen is present in air.
Bacteria release some free nitrogen back into the air. Bacteria in root nodules fix free nitrogen into compounds. Nitrogen Cycle Decomposers break down wastes and remains of organisms. Consumers obtain nitrogen by eating plants.

Similar presentations


 and organisms.>")


