Download presentation
Presentation is loading. Please wait.

1
Atmospheric Sciences 370 Observing Systems Winter 2016

2
ASOS: Automated Surface Observing System: Backbone Observing System in the U.S.

3
ASOS Located at primary and secondary airports Sponsored by the FAA and NWS High quality instrumentation that is well maintained and calibrated. Reported in METAR format (more later)
.")
4
Hydrothermograph

5
Precipitation Gauges

6
Laser Weather Identifier

7
Acoustic Anemometer

8
Anemometer Wind Vane Still used in many other systems

9
Laser Ceilometer

10
The ASOS Freezing Rain Sensor uses an ultrasonically vibrating probe to detect the presence of icing conditions. The vibrating frequency of the probe decreases with the accumulation of ice.

11
Lightning Sensor Visibility Sensor

12
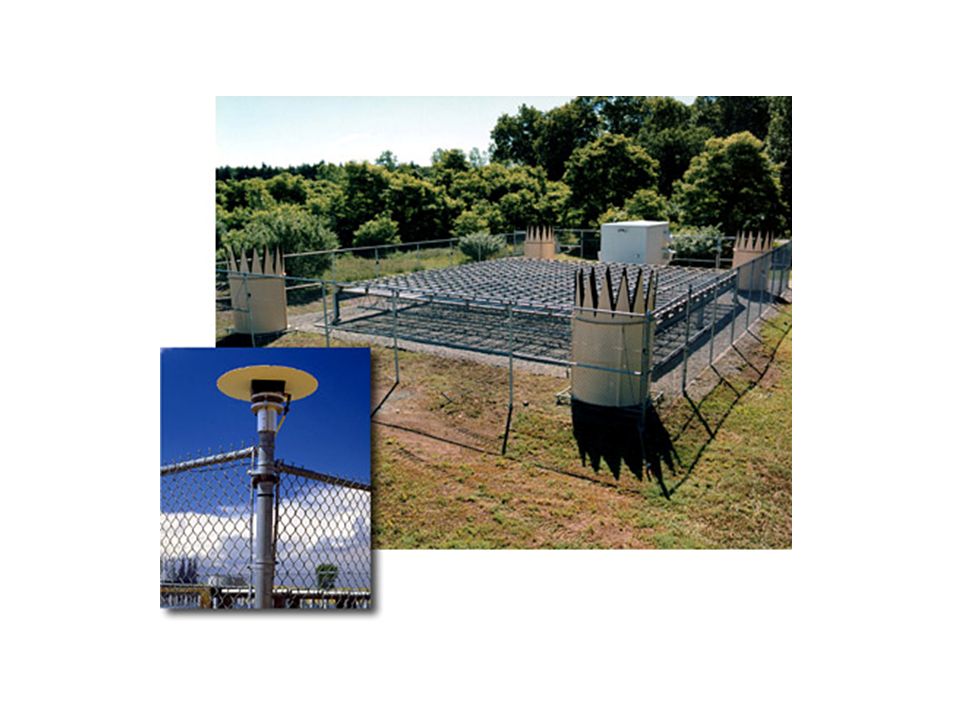
Full ASOS system in Arizona

13
METAR Format ASOS data (and airport observations worldwide) are transmitted in METAR format. Name came from the French words, MÉTéorologique ("Weather") Aviation Régulière ("Routine"). Example: KSEA 042353Z 11008KT 10SM FEW050 SCT070 OVC090 09/03 A2879 RMK AO2 SLP756 60001 T00940033 10117 20083 58013 Will learn more about it in Lab
 Aviation Régulière ( Routine ). Example: KSEA Z 11008KT 10SM FEW050 SCT070 OVC090 09/03 A2879 RMK AO2 SLP T Will learn more about it in Lab.")
14
Observing Heights (ASOS and most official obs) Temperature and dew point (2-m) Wind speed and direction (10-m)
 Temperature and dew point (2-m) Wind speed and direction (10-m)")
15
Other Surface Networks Bureau of Land Management RAWS Agrimet PAWS Department of Ecology Puget Sound Clean Air BC Hydro BC Olympics Weather Underground Many more!

16
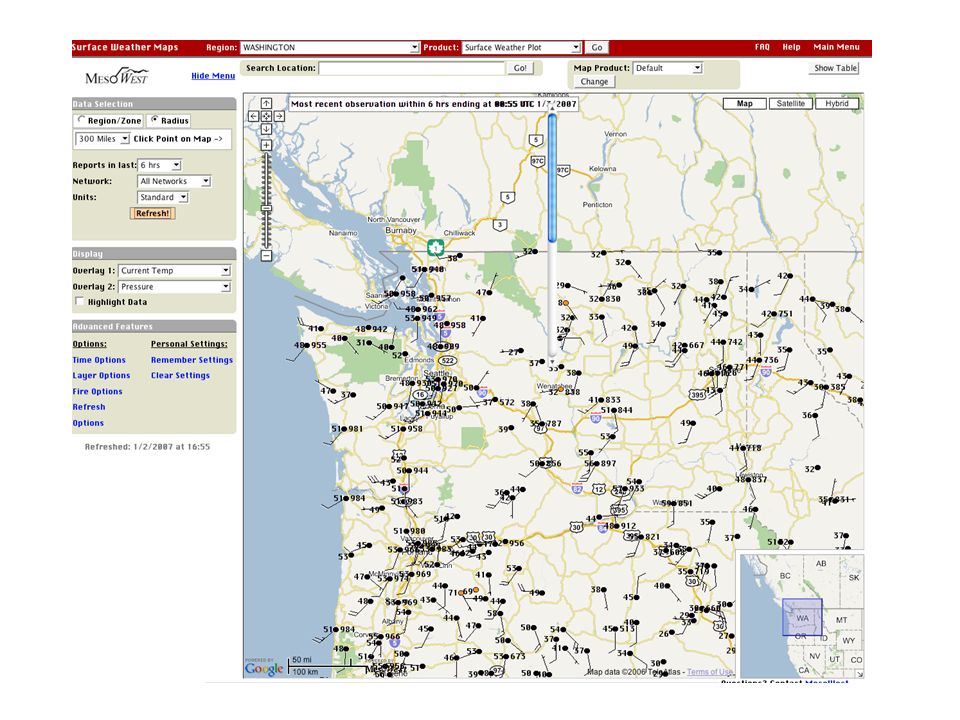
Pacific Northwest Surface Observations 3000-4000 observations per hour over WA and OR

17
Oklahoma Mesonet

18
Networks of Networks UW: We collect data from about 70 networks in real time over NW Mesowest: Collects about 100 networks over the western third of U.S. MADIS: national collection of mesonets

20
Marine Reports

21
Ocean and Lake Weather Buoys Anchored

22
Drifting Buoys Wind Pressure

23
Coastal Marine (CMAN) Reports from the Coast Guard
 Reports from the Coast Guard")
24
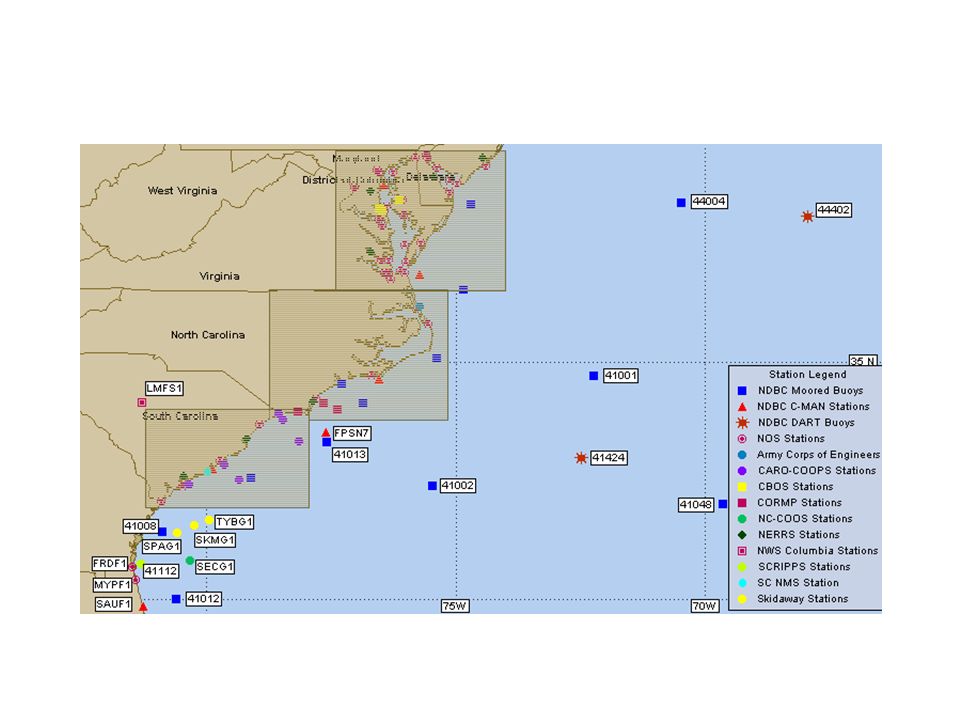
Northwest Buoy and CMAN Locations

26
Ship Reports: Marine VOS Program Volunteers Observers--generally 6-hourly reports Highly variable quality and frequency

27
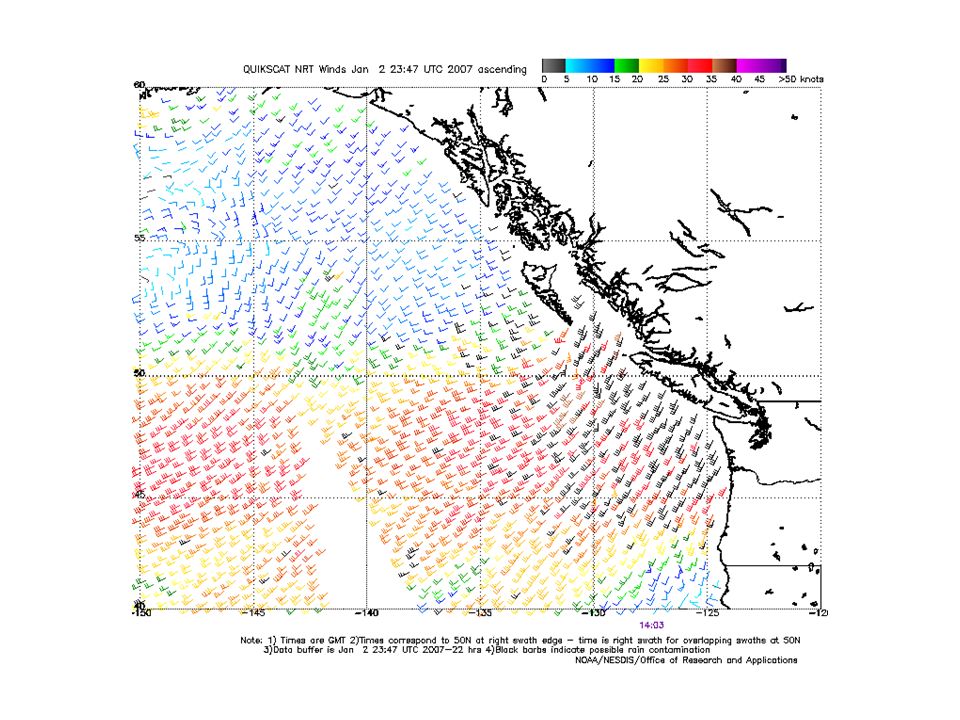
Satellite Microwave Scatterometer Winds

28
QuickScat Satellite Bounces microwaves off the ocean surface Capillary waves dependent on wind speed and directon

30
Satellite scatterometers

31
Satellite Altimetry of Sea Surface: Waves and Sea Level

32
Upper Air Data

33
Radiosonde

34
Radar Wind Profiler and RASS (Radio Acoustic Sounding System)
")
36
Seattle Profiler/RASS

37
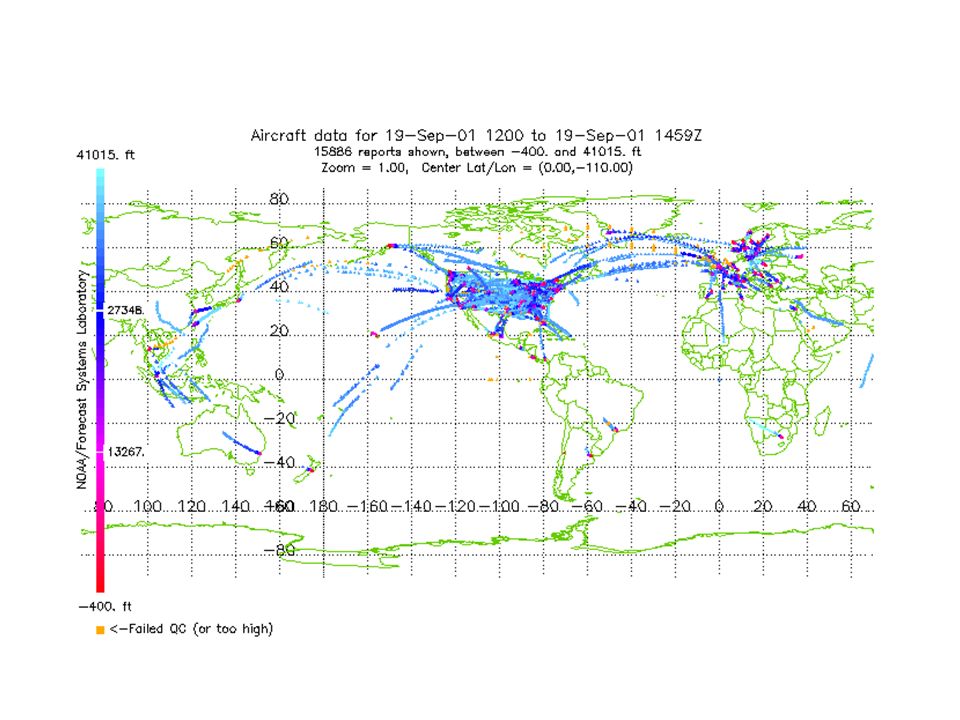
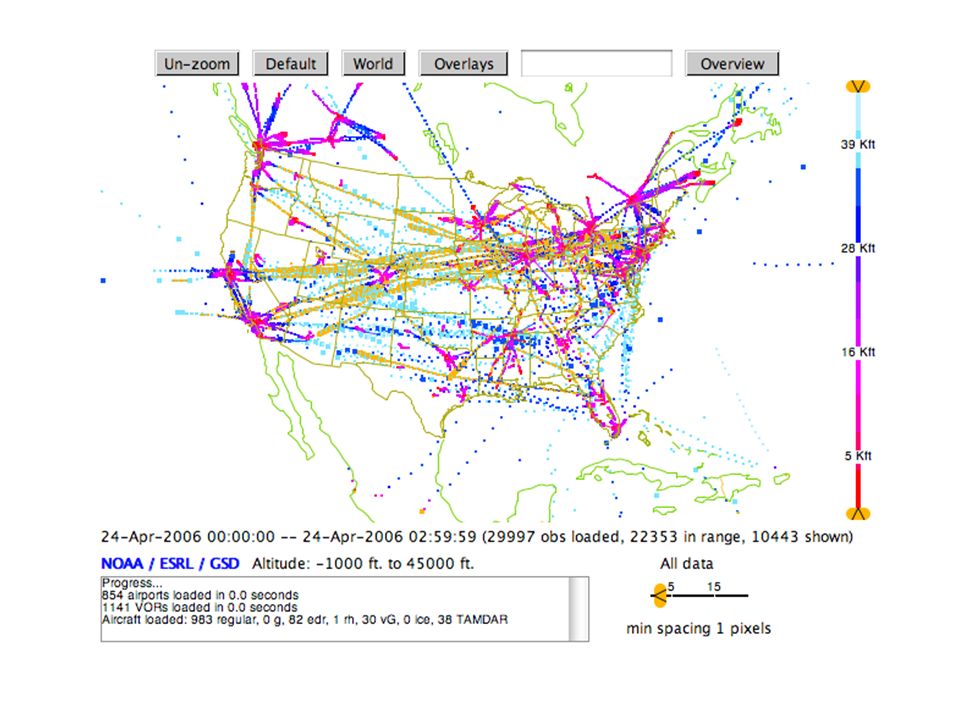
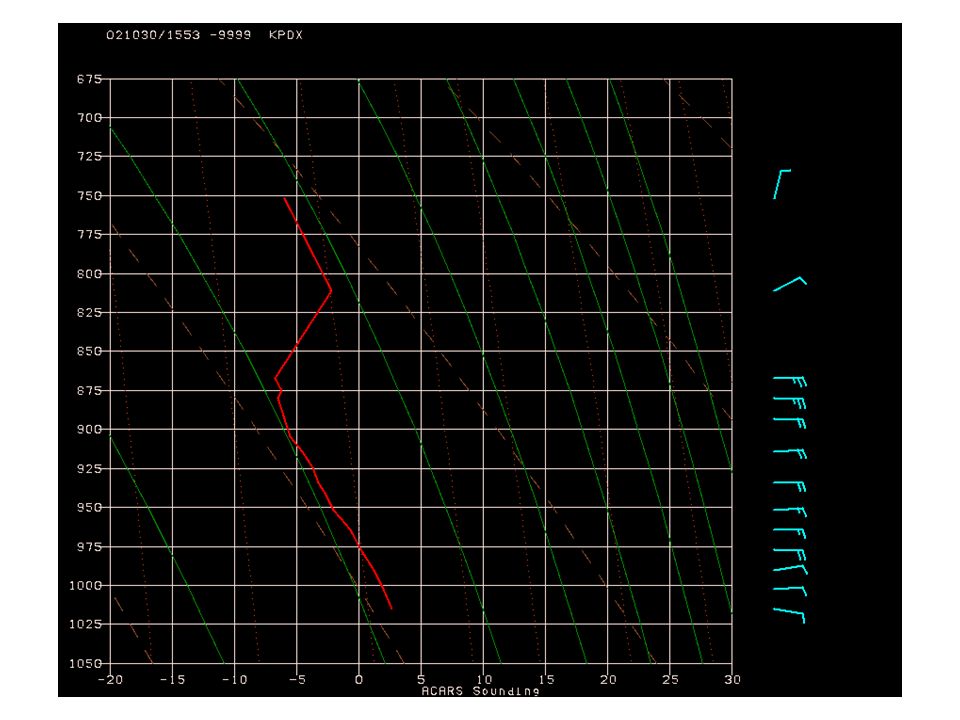
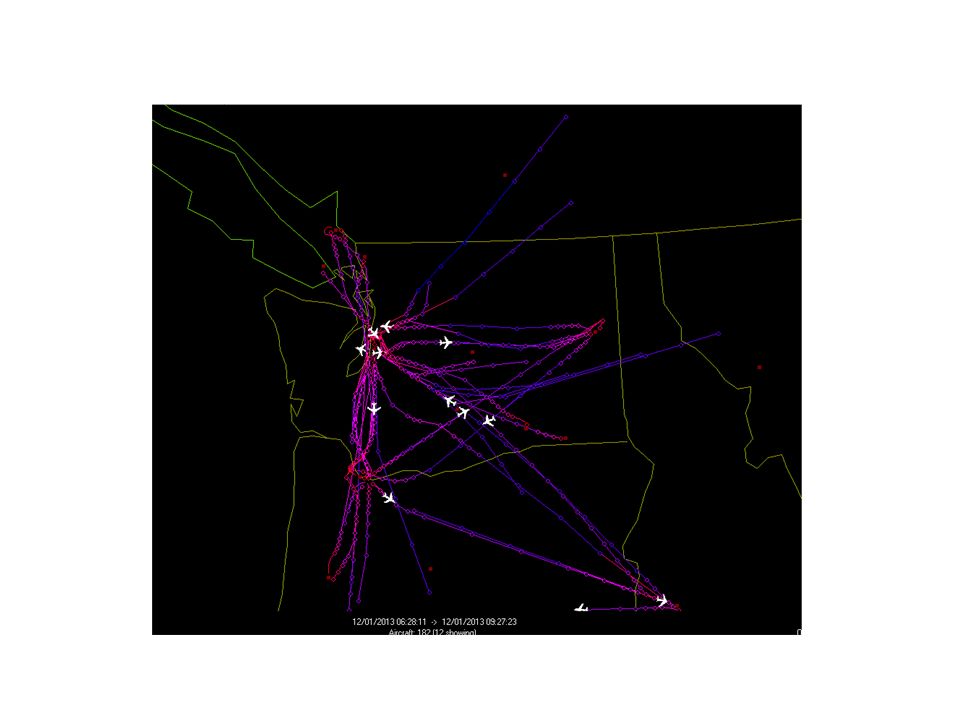
ACARS: Aircraft Observations Generally on wide-body aircraft Aircraft Communications Addressing and Reporting System

41
Now getting TAMDAR data from AIRDAT/Panasonic: Commuter and Short Haul Aircraft

44
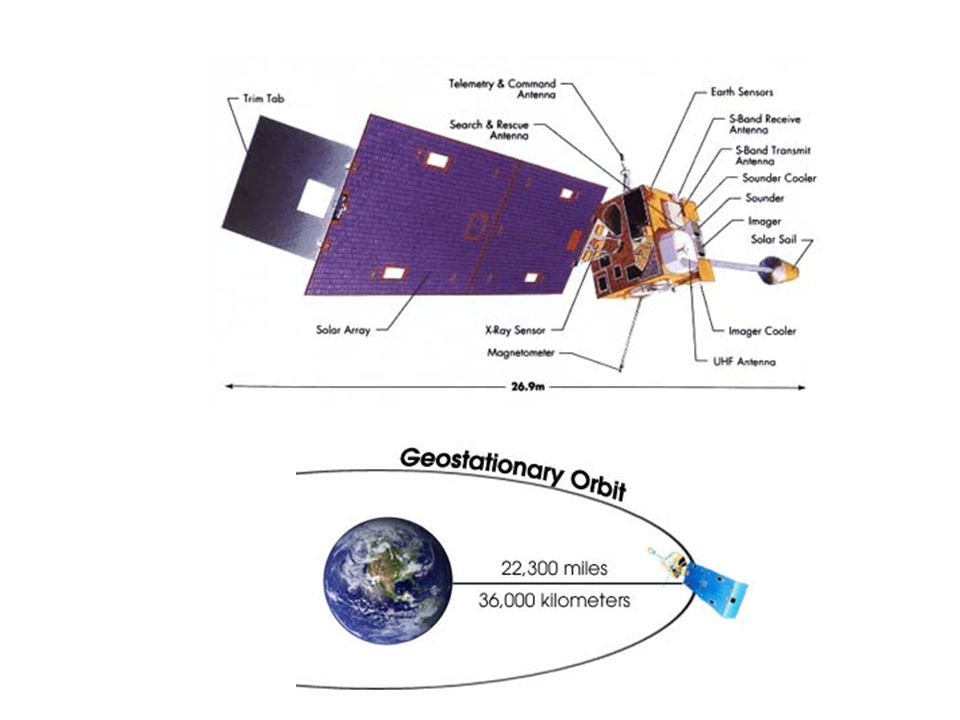
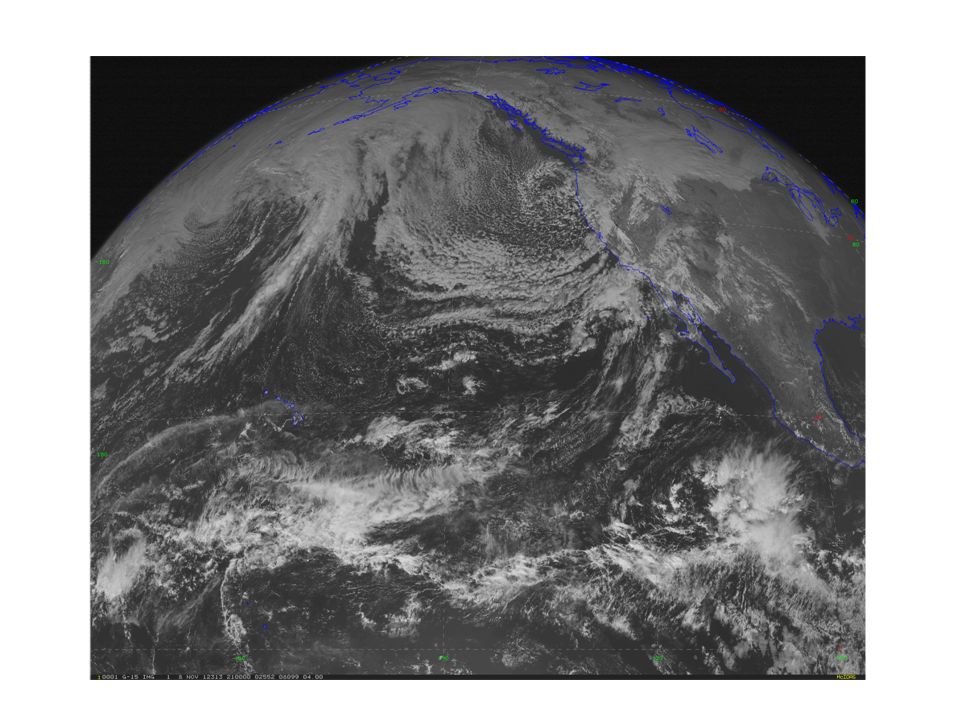
Satellite Data Geostationary and Polar Orbiting Satellites

46
NOAA Polar Orbiter Weather Satellite

48
Cloud and Water Vapor Track Winds Based on Geostationary Weather Satellites

50
GOES sounder unit

51
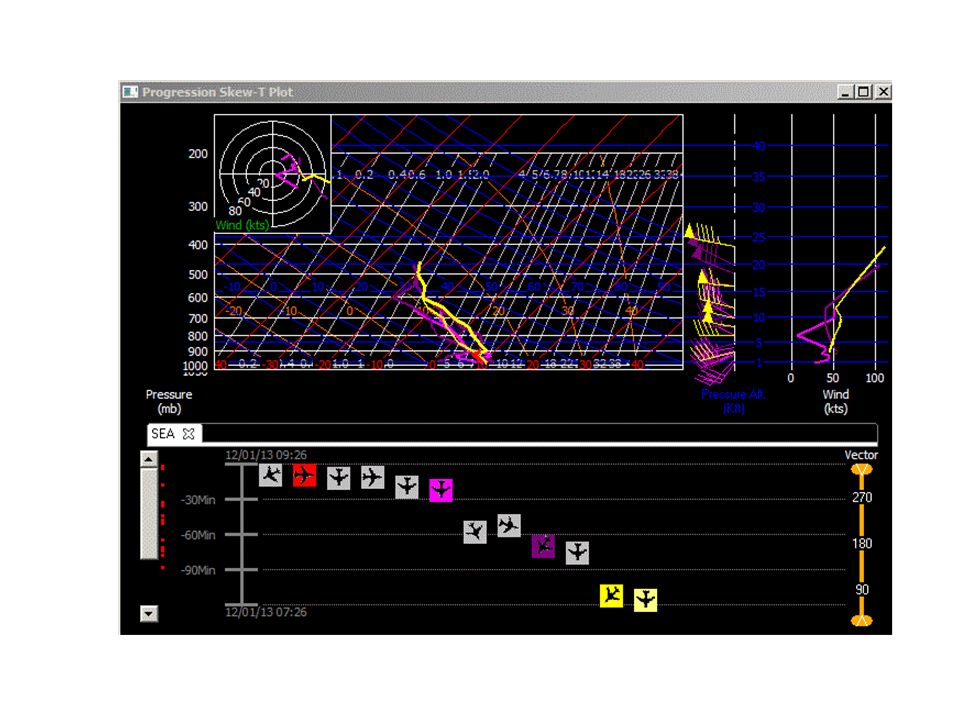
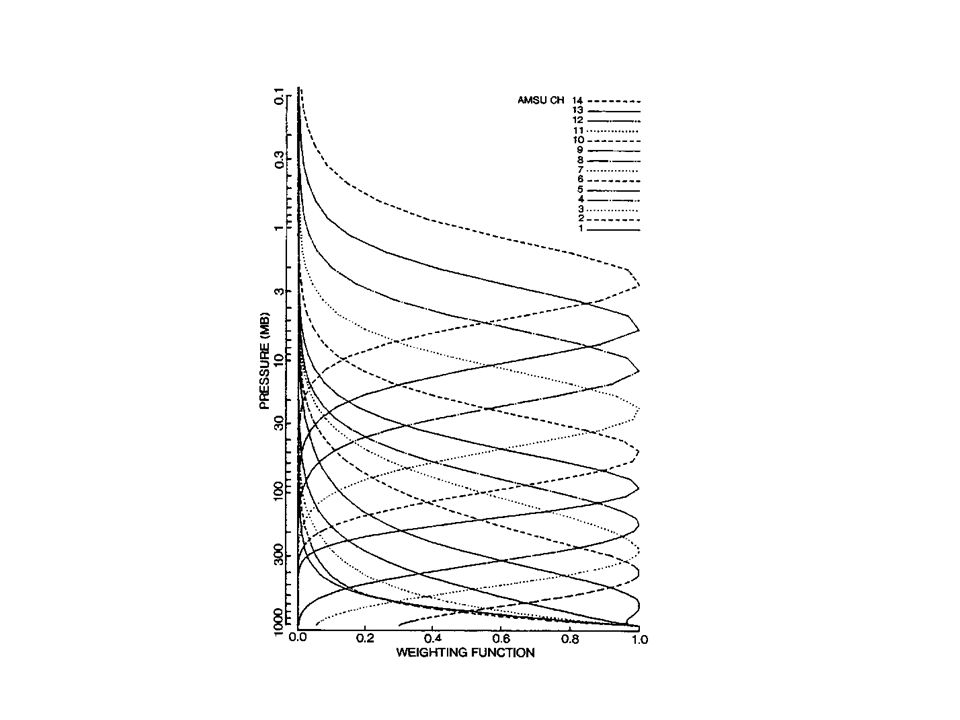
Satellite Temperature and Humidity Soundings

53
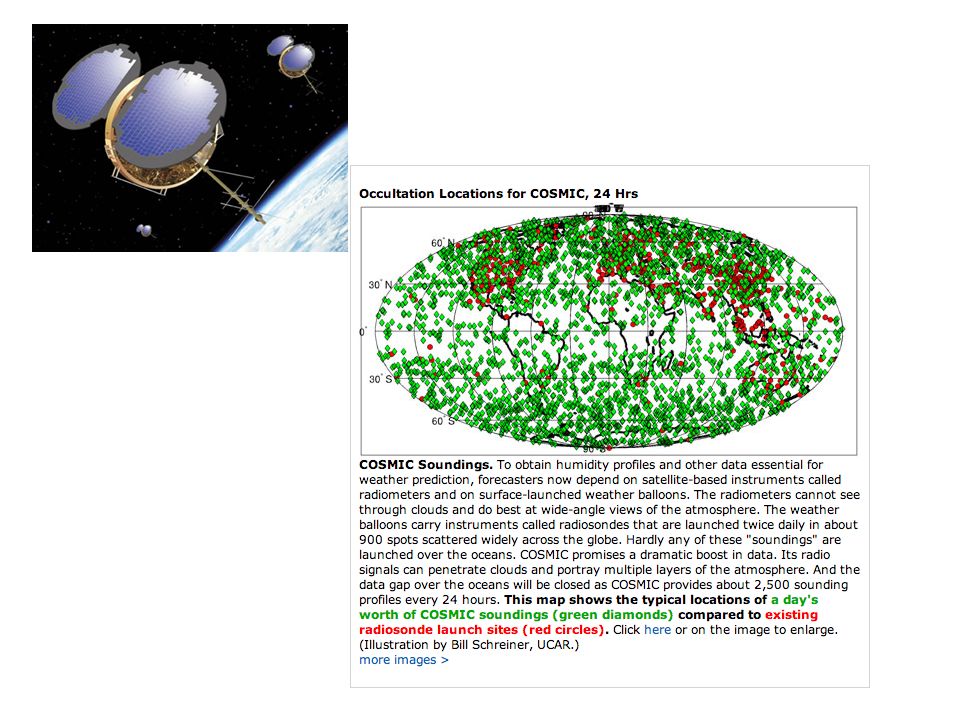
GPS Sounding A constellation of GPS satellites orbit the earth. A collection of other satellites can receive the GPS signal By measuring the delay in time as the GPS signal is bent by the earth’s atmosphere, one can acquire density information that can be used to create temperature and humidity soundings. Can do this with fixed receivers on earth or with receivers on satellites--the COSMIC project.

56
During the early 90s, the NWS installed a network of powerful Doppler Weather radars, a.k.a. NEXRAD WSR88D Weather Radar

57
NWS Radar Sites

58
Weather Radar Reflectivity (precipitation intensity) Doppler Velocities (radial velocities) Polarimetric Information (precipitation type and other information? Much more later in class

59
Camano Island Weather Radar

60
Typical Observation Errors at the Surface (Important when doing analyses!) Sea Level Pressure –Low-Elevation land stations +-.5 mb –Ships +- 1-5 mb Temperature: +-1C Wind Speed: +-2-5 knots, very light winds often a problem—especially for classical anomemeters. Relative Humidity: +-10%

61
Typical Radiosonde Errors Geopotential heights: –700 mb (hPa): 5-10 m –500 mb 10-15 m –300 mb 15-20 m –100 mb 20-30 m Temperature: +-0.5C Wind speed: +-5%,+-10 degrees
: 5-10 m –500 mb m –300 mb m –100 mb m Temperature: +-0.5C Wind speed: +-5%,+-10 degrees")
62
Terminology Direct versus Indirect observations –Direct: measurement at the location of the instrument –Indirect: remotely sensed using radiation measurements Active versus passive remote sensing –Active: instrument emits radiation, analyzes return –Passive: analyzes incoming natural radiation

63
The END

Similar presentations