Download presentation
Presentation is loading. Please wait.

1
Climate Graphs Learning Goal: I can construct, interpret, analyze, and apply climate graph data to Canada’s regions and human lifestyles.

2
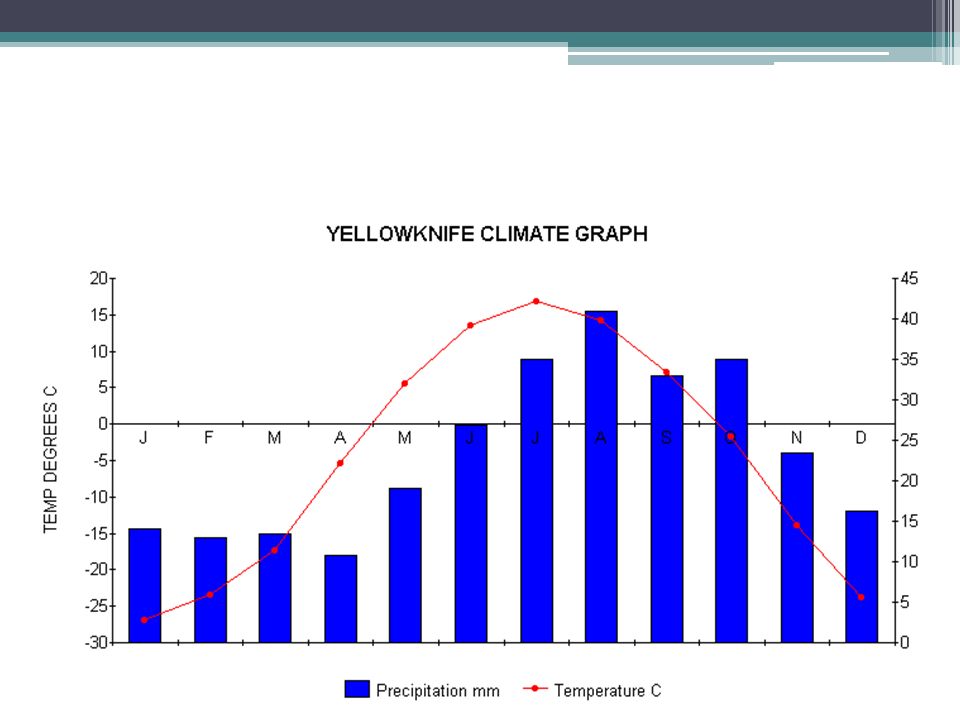
Datasets MonthJFMAMJJASOND Temp-6.9-5.8-1.36.412.618.120.619.715.69.52.9-3.9 Precip.605772757786848972698076 Here are two sets of data What is an effective way to display both of these data in a single graph? What are our graphing choices?

3
Climate Graph (Climograph) Why would a person every want to use a climate graph?
 Why would a person every want to use a climate graph")
5
How to make a climate graph - videoclimate graph

6
ANALYZING CLIMATE GRAPHS NAME OF FORMULAFORMULA Mean Annual Temperature (MAT) Add monthly temperatures ÷ by 12 *Round answer to 1 decimal place Annual Temperature Range (ATR) Take the highest (warmest) monthly temperature and − (subtract) from it the lowest (coldest) monthly temperature. *Remember 2 negatives make a positive! For Example: 20.1°C - (-3.4°C) = 20.1 + 3.4 = 23.5°C if the number is larger than 25°C = Continental Climate if the number is smaller than 25 C = Maritime Climate Total Annual Precipitation (TAP) Add (+) all monthly precipitation totals together. less than 1000mm = Continental Climate greater than 1000mm = Maritime Climate
 = = 23.5°C if the number is larger than 25°C = Continental Climate if the number is smaller than 25 C = Maritime Climate Total Annual Precipitation (TAP) Add (+) all monthly precipitation totals together. less than 1000mm = Continental Climate greater than 1000mm = Maritime Climate.")
Similar presentations


 precipitation and temperature for an area. It is used to compare the climate in different.>")


 + (+2) = +5 ( +3) + (+2) = +5 When a number is positive, you do not.>")


