Download presentation
Presentation is loading. Please wait.

1
Dr Marion Burkimsher Universities of Geneva and Lausanne Visualisation of fertility trends: Switzerland as a case study

2
Aims of presentation To introduce the HFC data for Switzerland - similar to HFD data but from ‘unofficial’ sources, ie. my derivation of biological birth orders from marital birth orders for 1969-2009 (see MPIDR Technical Report for more information) To illustrate some of the points already made in this symposium, using Switzerland as an example - or as a counter-example
 To illustrate some of the points already made in this symposium, using Switzerland as an example - or as a counter-example.")
3
1. 1.Special features of Swiss population 2. 2.Period trends 3. 3.Cohort trends 4. 4.Birth spacing

4
Special features of Swiss population

5
Swiss demographic landscape Possibly world’s highest mean age at first birth (almost 30) Possibly world’s highest mean age at first birth (almost 30) High proportion of women who remain childless (~20%) High proportion of women who remain childless (~20%) TFR reached a minimum of 1.38 in 2001, rising since then TFR reached a minimum of 1.38 in 2001, rising since then Relatively low proportion of births outside marriage Relatively low proportion of births outside marriage High proportion of foreign nationals and strong immigration High proportion of foreign nationals and strong immigration
 Possibly world’s highest mean age at first birth (almost 30) High proportion of women who remain childless (~20%) High proportion of women who remain childless (~20%) TFR reached a minimum of 1.38 in 2001, rising since then TFR reached a minimum of 1.38 in 2001, rising since then Relatively low proportion of births outside marriage Relatively low proportion of births outside marriage High proportion of foreign nationals and strong immigration High proportion of foreign nationals and strong immigration")
6
Less than 10% until 1999

9
Cohort sizes have changed considerably (>30% for cohorts 1965 and 1970 during the course of their reproductive life)!
!")
10
1946 cohort 1966 cohort 1990 cohort Female population by age 197120091 59

11
Period trends Trends in timing Trends in timing Trends in fertility rates by birth order Trends in fertility rates by birth order Recent rise in TFR Recent rise in TFR

13
Changes in fertility rate curves in period 1969-2009 Peak has become later (tempo change) Peak has become lower (quantum change) Curve has become wider Curve has changed from being skewed left to nearly symmetric
 Peak has become lower (quantum change) Curve has become wider Curve has changed from being skewed left to nearly symmetric")
14
196915200949 Fertility rates for 1st births

15
Years 1969.09 15 49 2009 0 Trends in birth order 1 fertility rates

16
In 1970 there was 11 years between modal age of 1st and 4th births In 2007 the difference was only 2 years!

17
Birth order 1 increase started 1971 Birth order 2 increase started 1973 Birth order 3 increase started 1980 Birth order 4 increase started 1986 Birth order 5+ increase started 1991 Gap between mean age at 1st birth and 4th birth declined from 8 years in 1972 to 4.9 in 1990 and since then has been steady

18
Postponement-recuperation Age-specific birth rates as proportion at same age in 1969-70-71

19
Birth order 1 increase started 1994 Birth order 2 increase started 1995 Birth order 3 increase started 1998 Birth order increase started 2001 Birth order 5+ increase started 2001 Reversal in order! 1st births had least variability, now most; high parities were most variable, now least

20
Corrected TFR is significantly higher than raw TFR

21
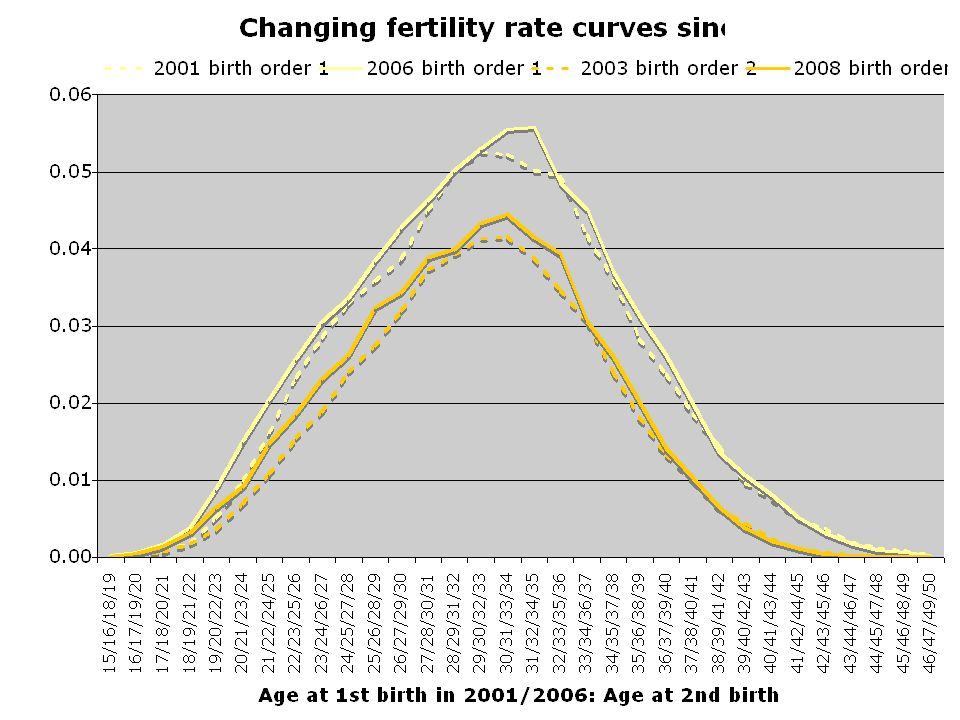
Marked rise 1976-1984, followed by gentle fall Slight peak in 2000 followed by sharp dip in 2001 Since 2001 has been steadily rising Rise in TFR between 2001 and 2006 was due to rise in birth order 1 fertility rates, ie. decline in incidence of childlessness Rise in TFR between 2007 and 2009 was due to increase in birth order 2 fertility rates

23
Difference (birth rate in year x for age y) - (birth rate in year x-5 for age y-1) Birth order 1 Birth order 2 15 49 19742009
 - (birth rate in year x-5 for age y-1) Birth order 1 Birth order")
24
Cohort trends By birth order By birth order Cohort-period model Cohort-period model Comparison of different data sets Comparison of different data sets

26
19401980cohorts 1st births 2nd births 3rd births 4th births 1969 2009

27
Model for estimating cohort fertility before full reproductive life is complete Can use it as soon as cohort has passed age of peak fertility for birth order 1 (ideally also birth order 2) Use cohort data to complete the curve with current year’s period data. This will ‘probably’ give an under-estimate of total fertility of youngest cohorts, as ongoing postponement will cause ongoing depression of fertility rates (for a while). Can be improved by making Bongaarts-Feeney correction to this added period data. However, this might give an over-estimate of the total cohort fertility, as there is ‘likely’ to be a slowing down on postponement in the future.
. Can be improved by making Bongaarts-Feeney correction to this added period data. However, this might give an over-estimate of the total cohort fertility, as there is ‘likely’ to be a slowing down on postponement in the future..")
30
Birth spacing (Not) difference in mean age of successive birth orders (Not) difference in mean age of successive birth orders Spacing data from surveys Spacing data from surveys Why these are very different Why these are very different
 difference in mean age of successive birth orders (Not) difference in mean age of successive birth orders Spacing data from surveys Spacing data from surveys Why these are very different Why these are very different")
33
Data on spacing in Switzerland FFS sample data from 1994 for women aged 40-44 ie. cohorts 1950-1954 Mean age at 1st birth 26.9 Spacing 1st-2nd child: 3.13 years Spacing 2nd-3rd child: 3.62 years Spacing 3rd-4th child: 3.13 years Deduced age at 2nd birth 30.0 Deduced age at 3rd birth 33.6 Deduced age at 4th birth 36.8 Houle & Shkolnikov, 2006

34
27 303336 Mean age at 1st birth: 27 Mean age at 2nd birth: 30 Mean age at 3rd birth: 33 Mean age at 4th birth: 36 Mean spacing between all birth orders: 3 years Mean age at last birth: 31.5 Age Scenario 1

35
27 303336 Mean age at 1st birth: 31.5 Mean age at 2nd birth: 33 Mean age at 3rd birth: 34.5 Mean age at 4th birth: 36 Mean spacing between all birth orders: 3 years Mean age at last birth: 36 Age Scenario 2

36
Conclusions We cannot deduce anything about birth spacing from differences in mean age at successive birth orders! We cannot deduce anything about mean age of successive birth orders from information on birth spacing! Hypothesis: around 1970 scenario 1 was the norm; this has evolved to become scenario 2. But need evidence for this (census 2000, Swiss Household Panel?)! (something for me to work on)
. (something for me to work on).")
37
Aims of presentation To introduce the HFC data for Switzerland - similar to HFD data but from ‘unofficial’ sources, ie. my derivation of biological birth orders from marital birth orders for 1969-2009 (see MPIDR Technical Report for more information) To illustrate some of the points already made in this symposium, using Switzerland as an example - or as a counter-example To question your mathematical models: do they make allowances for:Migration? Increase in width of fertility curve (more timing variation)? Change of shape of fertility curve? (something for you to work on?)
 To illustrate some of the points already made in this symposium, using Switzerland as an example - or as a counter-example To question your mathematical models: do they make allowances for:Migration. Increase in width of fertility curve (more timing variation). Change of shape of fertility curve. (something for you to work on ).")
38
Thank you!

Similar presentations


>")


 Anita Ratcliffe.>")


