Download presentation
Presentation is loading. Please wait.

1
Computer Science I Go over midterm. Reprise on curves. Table examples. The map function. Testing Strings. Fonts. Classwork/Homework: Complete midterm project.

2
Midterm Recap Difficulties

3
Bezier curves Look back at flower example. Ways to draw curves. Processing shape includes – vertex – bezierVertex (Bezier cubic) – quadVertex (Bezier quadratic) Processing procedure (others) is to start off curve with first anchor point, then specify control point or points, and next anchor point.
 – quadVertex (Bezier quadratic) Processing procedure (others) is to start off curve with first anchor point, then specify control point or points, and next anchor point..")
4
https://en.wikipedia.org/wiki/B%C3% A9zier_curve

5
Table Processing has built-in facilities for handling data in tables, such as comma separated values (csv) saved from spreadsheet (Excel) files. Table is an object defined by a class, much like we (the programmers) can do. The table needs to be added to the data folder using Sketch/Add File – Reference suggests that loadTable can accept a URL. Investigate this!
 can do. The table needs to be added to the data folder using Sketch/Add File – Reference suggests that loadTable can accept a URL. Investigate this!.")
6
Example My examples are only "stubs". You can and should add to them. – Read in csv file and display data after specific key pressed Chance to talk about strings. – Use Button class to set up buttons to display information on console. – Draw graph

7
Excel Create [simple] spreadsheet and Save As csv. – Will get warning that this format does not preserve all functionality of original.
![Excel Create [simple] spreadsheet and Save As csv.](http://images.slideplayer.com/32/9991062/slides/slide_7.jpg "– Will get warning that this format does not preserve all functionality of original..")
8
In Processing Sketch/Add file … – So this will go into data folder. My sketches don't use the header row—but my code needs to say there is a header My sketches don't use the Total column.

9
Planning Global variables for the whole table and for 3 columns of data Define setup, draw, keyPressed methods plus my extractdata method.

10
Start of Sketch int[] quizScores; int[] projectScores; int numOfStudents; String[] names; void setup() { size(900,600); fill(0); allScores = loadTable("scores.csv","header"); extractdata(allScores); }
![Start of Sketch int[] quizScores; int[] projectScores; int numOfStudents; String[] names; void setup() { size(900,600); fill(0); allScores = loadTable( scores.csv , header ); extractdata(allScores); }](http://images.slideplayer.com/32/9991062/slides/slide_10.jpg "Start of Sketch int[] quizScores; int[] projectScores; int numOfStudents; String[] names; void setup() { size(900,600); fill(0); allScores = loadTable( scores.csv , header ); extractdata(allScores); }")
11
Extracting the data void extractdata(Table info) { numOfStudents = info.getRowCount(); quizScores = new int[numOfStudents]; projectScores = new int[numOfStudents]; names = new String[numOfStudents]; for (int i=0;i<numOfStudents;i++){ quizScores[i] = info.getInt(i,2); projectScores[i] = info.getInt(i,1); names[i] = info.getString(i,0); }
![Extracting the data void extractdata(Table info) { numOfStudents = info.getRowCount(); quizScores = new int[numOfStudents]; projectScores = new int[numOfStudents]; names = new String[numOfStudents]; for (int i=0;i<numOfStudents;i++){ quizScores[i] = info.getInt(i,2); projectScores[i] = info.getInt(i,1); names[i] = info.getString(i,0); }](http://images.slideplayer.com/32/9991062/slides/slide_11.jpg "Extracting the data void extractdata(Table info) { numOfStudents = info.getRowCount(); quizScores = new int[numOfStudents]; projectScores = new int[numOfStudents]; names = new String[numOfStudents]; for (int i=0;i<numOfStudents;i++){ quizScores[i] = info.getInt(i,2); projectScores[i] = info.getInt(i,1); names[i] = info.getString(i,0); }")
12
Display after keyPressed Before showing code: The key is a char, NOT a String. Also, the user may click simply on a letter and NOT make it uppercase. Need to check for two Strings being equal. – The == will not work! Also, need to space out the display of the information (or do something else to avoid text on top of text).
..")
13
To make something a String Use the str function. This works for char values and for int values.

14
Ensure specific case The String class has the toLowerCase and toUpperCase methods. If something already is that case, no problem.

15
String equality The == does not work, but there is a String method equals, so To compare two Strings, aString and bString, we can code if (aString.equals(bString)) returns true or false.
) returns true or false.")
16
So, keyPressed void keyPressed () { //key is what is pressed for (int i=0;i<numOfStudents;i++) { String initial = str(names[i].charAt(0)); String keyS = str(key); if ((keyS.equals(initial))||(keyS.equals(initial.toLowerCase()))) { String msg=names[i]+" scored "+str(quizScores[i])+" on the quiz and "+str(projectScores[i]) +" on the project."; text(msg,100,100+i*60); }
![So, keyPressed void keyPressed () { //key is what is pressed for (int i=0;i<numOfStudents;i++) { String initial = str(names[i].charAt(0)); String keyS = str(key); if ((keyS.equals(initial))||(keyS.equals(initial.toLowerCase()))) { String msg=names[i]+ scored +str(quizScores[i])+ on the quiz and +str(projectScores[i]) + on the project. ; text(msg,100,100+i*60); }](http://images.slideplayer.com/32/9991062/slides/slide_16.jpg "So, keyPressed void keyPressed () { //key is what is pressed for (int i=0;i<numOfStudents;i++) { String initial = str(names[i].charAt(0)); String keyS = str(key); if ((keyS.equals(initial))||(keyS.equals(initial.toLowerCase()))) { String msg=names[i]+ scored +str(quizScores[i])+ on the quiz and +str(projectScores[i]) + on the project. ; text(msg,100,100+i*60); }")
17
The map function The map does a scaling type operation. Processing has an operation called scale that is a coordinate transformation. The map function is great for taking a number in one range and calculating its value transformed into another range. So I use it to produce a graph.

18
This point has y coordinate 7 in range 0 to 12. I need to calculate the pixel coordinate In range here to here.

19
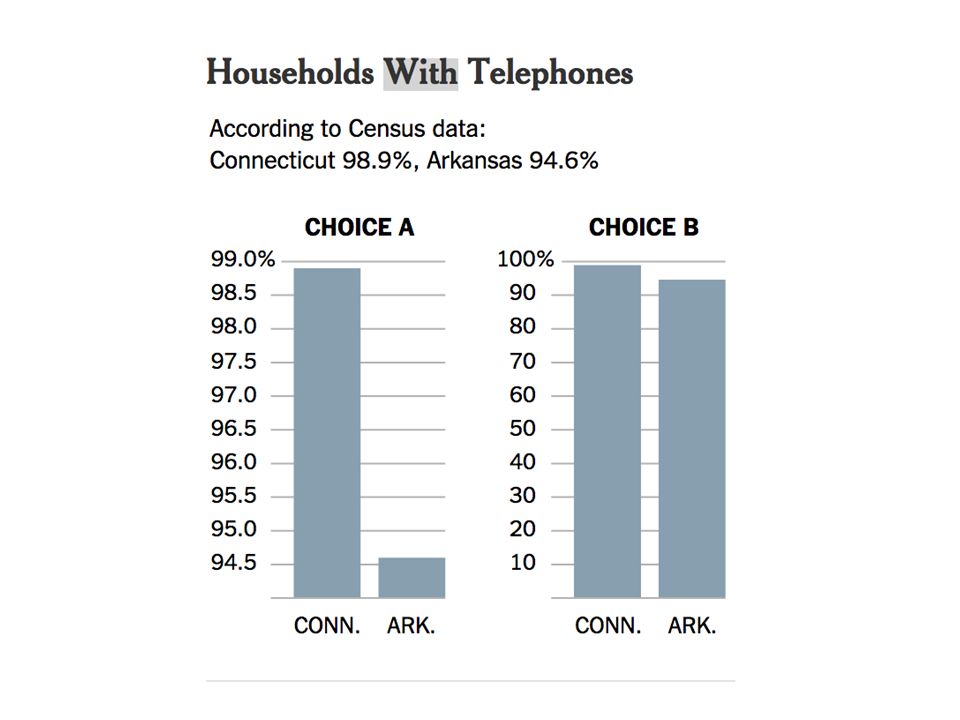
Diversion: Reading graphs It may be your job to produce a graph/chart/visualization to communicate data. Reference: http://www.nytimes.com/2016/02/28/opinion/s unday/the-wrong-way-to-teach-math.html http://www.nytimes.com/2016/02/28/opinion/s unday/the-wrong-way-to-teach-math.html Challenge: census data indicates percentage of households with telephones. Charts on next page compare Connecticut and Arkansas. Which is a better choice to use?

21
Is this … a false choice? Only 2 values: 98.9% vs 94.6% OR… should comparison be 1.1% vs 5.4% the percentage of households without telephones OR Should the comparison be between absolute numbers rather than percentages OR ???

22
Planning: Showing fonts Get a list of the fonts available. Use mousePressed to display a random choice.

23
String[] fontList ; PFont myfont; void setup() { size(800, 600); fill(255,0,0); fontList = PFont.list(); println(fontList); //prints the whole list }
![String[] fontList ; PFont myfont; void setup() { size(800, 600); fill(255,0,0); fontList = PFont.list(); println(fontList); //prints the whole list }](http://images.slideplayer.com/32/9991062/slides/slide_23.jpg "String[] fontList ; PFont myfont; void setup() { size(800, 600); fill(255,0,0); fontList = PFont.list(); println(fontList); //prints the whole list }")
24
void draw() { //put in to enable mouse events } void mousePressed() { int ch = int(random(0,fontList.length)); myfont = createFont(fontList[ch],20); textFont(myfont); //set current font text(fontList[ch],mouseX,mouseY); }
![void draw() { //put in to enable mouse events } void mousePressed() { int ch = int(random(0,fontList.length)); myfont = createFont(fontList[ch],20); textFont(myfont); //set current font text(fontList[ch],mouseX,mouseY); }](http://images.slideplayer.com/32/9991062/slides/slide_24.jpg "void draw() { //put in to enable mouse events } void mousePressed() { int ch = int(random(0,fontList.length)); myfont = createFont(fontList[ch],20); textFont(myfont); //set current font text(fontList[ch],mouseX,mouseY); }")
25
Classwork/Homework Look over table examples. Show what you have for midterm project – probably not complete – Always good to work in stages. Finish project and upload.

Similar presentations