Download presentation
Presentation is loading. Please wait.

1
SUMMARY EQT 271 MADAM SITI AISYAH ZAKARIA SEMESTER 2 2014/2015

2
CHAPTER 1 – PART 3 SAMPLING DISTRIBUTION 0 INTRODUCTION 0 PURPOSE OF SAMPLING 0 SAMPLING FRAME AND SAMPLING PLAN 0 TYPES OF SAMPLING 0 SAMPLING DISTRIBUTION 0 - OF THE SAMPLE MEAN 0 - OF THE SAMPLE PROPORTION 0 - OF DIFFERENCE BETWEEN TWO MEAN 0 - OF DIFFERENCE BETWEEN TWO PROPORTION

3
SAMPLING DISTRIBUTION – SAMPLE ONE MEAN 0 STATE THE SAMPLING DISTRIBUTION 0 STATE WHAT IS ? 0 CALCULATE Z VALUE BY USING: Variance knownVariance unknown n ≥ 30 ; n < 30n ≥ 30 n < 30

4
0 After Get Z Value – Refer Z Table To Get The Probability For The Question 0 DRAW FIGURE For Z Value To Easy Get The Probability For Area. 0 KNOW HOW TO READ Z (ALFA) TABLE CONTINUE …SAMPLING DISTRIBUTION – SAMPLE ONE MEAN
 TABLE CONTINUE …SAMPLING DISTRIBUTION – SAMPLE ONE MEAN.")
5
0 FOR PROPORTION 0 STATE SAMPLING DISTRIBUTION 0 CALCULATE Z VALUE – refer table to get probability for the area (draw figure) SAMPLING DISTRIBUTION – SAMPLE ONE PROPORTION and
 SAMPLING DISTRIBUTION – SAMPLE ONE PROPORTION and")
6
0 REFER MIND MAP. 0 KNOW HOW TO INTERPRET THE VALUE FOR CONFIDENT INTERVAL CHAPTER 2 – PART 1 CONFIDENT INTERVAL It means that for sample mean (sampling) For population mean – after you get the value..it means that this two value for population mean
 For population mean – after you get the value..it means that this two value for population mean.")
7
CHAPTER 2 – PART 2 SAMPLE SIZE MEAN PROPORTION

8
CHAPTER 2 – PART 3 HYPOTHESIS TESTING Hypothesis and Test Procedures A statistical test of hypothesis consist of : 1. The Null hypothesis, The Alternative hypothesis, 2. The test statistic – Z test or t test 3. Z- value or t- value (from table) or p-value 4. The rejection region (draw figure) 5. The conclusion – Reject or Do not Reject
 or p-value 4. The rejection region (draw figure) 5. The conclusion – Reject or Do not Reject.")
9
1. HYPOTHESIS TESTING CONTINUE …..CHAPTER 2 – PART 3 HYPOTHESIS TESTING Two-Tailed TestLeft-Tailed Test Right-Tailed Test Sign in= <> Rejection RegionIn both tailIn the left tailIn the right tail Rejection Region

10
2. TEST STATISTICS – ONE MEAN 10 any population, is known and n is large or normal population, is known and n is small any population, is unknown and n is large normal population, is unknown and n is small CONTINUE …..CHAPTER 2 – PART 3 HYPOTHESIS TESTING

11
11 CONTINUE …..CHAPTER 2 – PART 3 HYPOTHESIS TESTING 2. TEST STATISTICS – TWO POPULATION MEAN

12
12

13
Alternative hypothesisRejection Region 13

14
14 Alternative hypothesisRejection Region CONTINUE …..CHAPTER 2 – PART 3 HYPOTHESIS TESTING ONE PROPORTION

15
CONTINUE …..CHAPTER 2 – PART 3 HYPOTHESIS TESTING TWO PROPORTION

16
16 Alternative hypothesisRejection Region

17
HYPOTHESIS TESTING BY USING P-VALUE 17

18
Definition 2.6: p-value 0 The p-value is the smallest significance level at which the null hypothesis is rejected. 0 The p-value is the actual probability of getting the sample mean if the null hypothesis is true. 18

19
0 A researcher wishes to test the claim that the average cost of tuition and fees at a four year public college is greater than $5700. She selects a random sample of 36 four-year public colleges and finds the mean to be $5950. The population standard deviation is $659. Is there evidence to support the claim at a 0.05? Use the P-value method. EXAMPLE 1 19

20
1. 2. Test Statistics 3. P-value. Using Table m/s 24, z = 2.28. It is 0.5 + 0.4887 = 0.9887. p-value = 1.0000 - 0.9887=0.0113 0.5 – 0.4887 = 0.0113 4. Rejection region [draw diagram] – compare with alpha = 0.05 P-value (0.0113) < 0.05, the decision is to reject 5. Conclusion There is enough evidence to support the claim that the tuition and fees at four- year public colleges are greater than $5700. SOLUTION 1 20
 < 0.05, the decision is to reject 5. Conclusion There is enough evidence to support the claim that the tuition and fees at four- year public colleges are greater than $5700. SOLUTION")
21
0 A researcher claims that the average wind speed in a certain city is 8 miles per hour. A sample of 32 days has an average wind speed of 8.2 miles per hour. The standard deviation of the population is 0.6 mile per hour. At a 0.05, is there enough evidence to reject the claim? Use the P-value method. EXAMPLE 2 21

22
SOLUTION 2 22 1. 2. Test Statistics 3. P-value. Using Table m/s 24, z = 2.28. It is 0.5 + 0.4706 = 0.9706. p-value = 1.0000 - 0.9706=0.0294 Since this is a two-tailed test, the area of 0.0294 must be doubled to get the ------ P-value - 2(0.0294) = 0.0588 4. Rejection region [draw diagram] – compare with alpha = 0.05 P-value (0.0588) > 0.05, the decision is do not reject 5. Conclusion There is not enough evidence to reject the claim that the average wind speed is 8 miles per hour
 = Rejection region [draw diagram] – compare with alpha = 0.05 P-value (0.0588) > 0.05, the decision is do not reject 5. Conclusion There is not enough evidence to reject the claim that the average wind speed is 8 miles per hour.")
23
RELATIONSHIP BETWEEN HYPOTHESIS TESTING AND CONFIDENT INTERVAL

24
For the single mean & proportion Confidence Interval vs Hypothesis Testing At the same level in confidence interval and hypothesis testing, when the null hypothesis is rejected, the confidence interval for the mean and proportion will not contain the hypothesized mean/proportion. Likewise, when we do not reject null hypothesis the confidence interval will contain the hypothesized mean/ proportion. ** Applies only for two-tailed test. Allan Bluman, pg. 458

25
For the difference of means & proportions Confidence Interval vs Hypothesis Testing [-8.5, 8.5] Contains zero = If the CI contains zero, we do not reject H 0 (Means that the there is NO DIFFERENCE in population means or proportions) [5.45, 12.45] No zero = If the CI does not contain zero, we reject H 0 (Mean/proportion for population 1 is GREATER than the mean/proportion for population 2) There is difference in population means [-7.3, -3.3] No zero = If the CI does not contain zero, we reject H 0 (Mean/proportion for population 1 is LESS than the mean/proportion for population 2) There is difference in population means ** Applies only for two-tailed test. Eg. in Allan Bluman, pg. 477-478.
![For the difference of means & proportions Confidence Interval vs Hypothesis Testing [-8.5, 8.5] Contains zero = If the CI contains zero, we do not reject H 0 (Means that the there is NO DIFFERENCE in population means or proportions) [5.45, 12.45] No zero = If the CI does not contain zero, we reject H 0 (Mean/proportion for population 1 is GREATER than the mean/proportion for population 2) There is difference in population means [-7.3, -3.3] No zero = If the CI does not contain zero, we reject H 0 (Mean/proportion for population 1 is LESS than the mean/proportion for population 2) There is difference in population means ** Applies only for two-tailed test.](http://images.slideplayer.com/32/9982266/slides/slide_25.jpg "Eg. in Allan Bluman, pg")
26
CHAPTER 3 ANOVA

27
Hypothesis and Test Procedures A statistical test of hypothesis consist of : 1. The Null hypothesis, The Alternative hypothesis, 2. The test statistic – ANOVA TABLE 3. F value (from table) or p-value 4. The rejection region (draw figure) 5. The conclusion – Reject or Do not Reject
 or p-value 4. The rejection region (draw figure) 5. The conclusion – Reject or Do not Reject.")
28
0 KNOW ABOUT THEORY – REFER SLIDE 0 HYPOTHESIS TESTING 0 H 0 : µ 1 = µ 2 =... = µ t * 0 H 1 : µ i µ j for at least one pair (i,j) 0 TEST STATISTICS – MUST HAVE THIS TABLE AFTER YOUR CALCULATION CHAPTER 3 – PART 1 ANOVA – ONE-WAY
 0 TEST STATISTICS – MUST HAVE THIS TABLE AFTER YOUR CALCULATION CHAPTER 3 – PART 1 ANOVA – ONE-WAY.")
29
CONCLUSION Do Not Reject H 0 No difference in mean Between- group variance estimate approximately equal to the within-group variance F test value approximately equal to 1 Reject H 0 Difference in mean Between- group variance estimate will be larger than within-group variance F test value = greater than 1

30
0 KNOW ABOUT THEORY – REFER SLIDE 0 HYPOTHESIS TESTING Two Sets of Hypothesis: Treatment Effect: Block Effect: H 0 : 1 = 2 =... = t =0 H 0 : i = 0 for each value of i through n H 1 : j 0 at least one j H 1 : i ≠ 0 at least one i 0 TEST STATISTICS – MUST HAVE ANOVA TABLE AFTER YOUR CALCULATION CHAPTER 3 – PART 2 ANOVA – TWO-WAY(WITHOUT)
.")
31
Randomized Block Design, cont. ANOVA Table Source of Variation Sum of Squares Degrees of Freedom Mean Square Fp -Value Treatments SSTRt-1 Blocks SSBLn-1 ErrorSSE(t-1)(n-1) TotalSSTtn-1
(n-1) TotalSSTtn-1.")
32
CHAPTER 3 – PART 3 ANOVA – TWO-WAY(WITH) 0 KNOW ABOUT THEORY – REFER SLIDE Three Sets of Hypothesis: i. Factor A Effect: H 0 : 1 = 2 =... = a =0 (there is no effect on Factor A) H 1 : at least one i 0 (there is an effect on Factor A) ii. Factor B Effect: H 0 : 1 = 2 =... = b =0 (there is no effect on Factor B) H 1 : at least one j ≠ 0 (there is an effect on Factor B) iii. Interaction Effect: H 0 : ( ) ij = 0 for all i,j (there is no interaction AB effect) H 1 : at least one ( ) ij 0 (there exist an interaction AB effect)
 H 1 : at least one i 0 (there is an effect on Factor A) ii. Factor B Effect: H 0 : 1 = 2 =... = b =0 (there is no effect on Factor B) H 1 : at least one j ≠ 0 (there is an effect on Factor B) iii. Interaction Effect: H 0 : ( ) ij = 0 for all i,j (there is no interaction AB effect) H 1 : at least one ( ) ij 0 (there exist an interaction AB effect).")
33
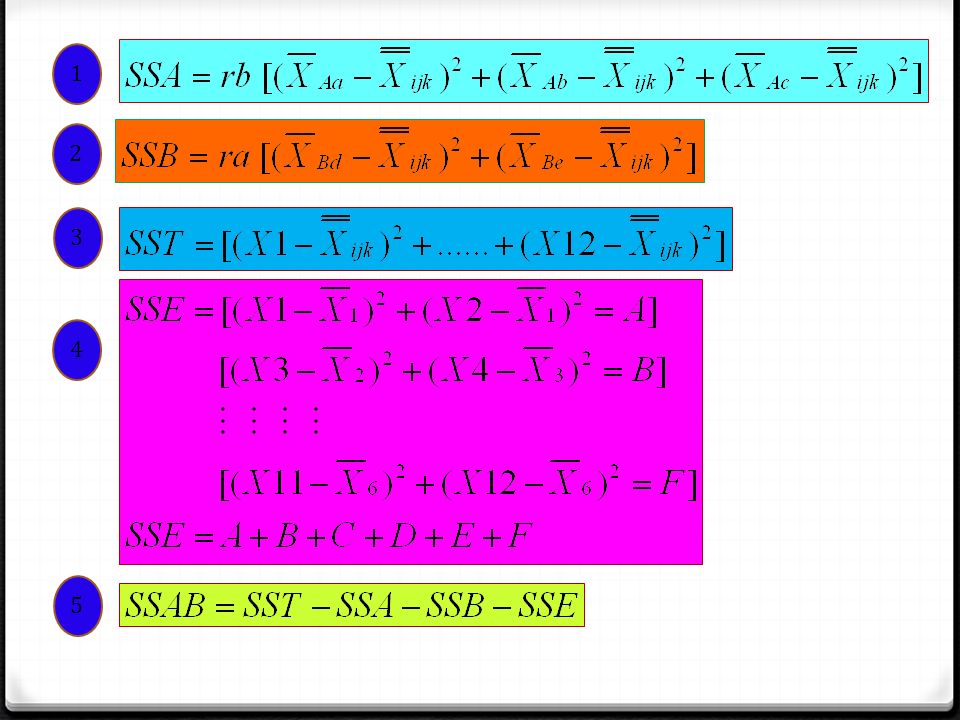
FACTOR A FACTOR B abc Total mean (factor B) d X1 X2 A X3 X4 B X5 X6 C e X7 X8 D X9 X10 E X11 X12 F Total mean (factor A) Grand mean a = no. of Factor A b = no. of Factor B 2.TEST STATISTIC

34
1 3 4 5 2
35
Two-Factor Factorial Experiment, cont. Two-Factor ANOVA Table Source of Variation Sum of Squares Degrees of Freedom Mean Square Fp -Value Factor A SSAa-1 Factor B SSBb-1 InteractionSSAB(a-1)(b-1) ErrorSSEab(r-1) TotalSSTabr-1
(b-1) ErrorSSEab(r-1) TotalSSTabr-1.")
36
Graphical No interaction or have interaction

37
Exploring Interaction between Factors in Two-Way ANOVA The lines in the graph is parallel or approximately parallel. There is no significant interaction effect between the factor. The difference in estimated means between the two fertilizer levels is the same for each manure level. The effect of two factor is same

38
Exploring Interaction between Factors in Two-Way ANOVA 0 A graph showing interaction: Intersection occur – disordinal interaction (SOME INTERACTION) - Not more effect No intersection – ordinal interaction (SIGNIFICANT INTERACTION) - have more effect
 - Not more effect No intersection – ordinal interaction (SIGNIFICANT INTERACTION) - have more effect")
39
CHAPTER 4 SIMPLE LINEAR REGRESSION & CORRELATION

40
Regression line Linear regression model Regression equation model Positive or negative relationship Predict the value Coefficient of determination Interpret: It means that 81% of the variation in the dependent variable (Y) is accounted for by the variations in the independent variable (X). Coefficient of correlation Interpret: Values of r close to 1 implies there is a strong positive linear relationship between x and y. Values of r close to -1 implies there is a strong negative linear relationship between x and y. Values of r close to 0 implies little or no linear relationship between x and y.

41
Scatter plot Positive relationship Regression line – plot approximate to the line, it means that strong positive relationship If x increase y also increase and if x decrease y also decrease Negative relationship Regression line – plot approximate to the line, it means that strong negative relationship If x increase y will decrease and if x decrease y will increase

42
Hypothesis and Test Procedures A statistical test of hypothesis consist of : 1. The Null hypothesis, The Alternative hypothesis, 2. The test statistic – t TEST OR F TEST 3. F value OR t value (from table) or p-value 4. The rejection region (draw figure) 5. The conclusion – Reject or Do not Reject TEST FOR LINEARITY OF REGRESSION
 or p-value 4. The rejection region (draw figure) 5. The conclusion – Reject or Do not Reject TEST FOR LINEARITY OF REGRESSION.")
43
CHAPTER 5 NONPARAMETRIC STATISTICS

44
NONPARAMETRIC STATISTICS In general, a statistical technique is categorized as NPS if it has at least one of the following characteristics: 1. The method is used is not normal distributed 2. The method is used on nominal data 3. The method is used in ordinal data 4. The method is used in interval scale or ratio scale data but there is no assumption regarding the probability distribution of the population where the sample is selected. Sign Test Wilcoxon Signed Rank Test Mann-Whitney Test Kruskal Wallis Test REFER EXTRA NOTE AND SLIDE

45
Hypothesis and Test Procedures A statistical test of hypothesis consist of : 1. The Null hypothesis, The Alternative hypothesis, 2. The test statistic 3. Critical value 4. The rejection region – comparison between test statistic & critical value 5. The conclusion – Reject or Do not Reject

46
CLASS EVALUATION

47
http://imk.unimap.edu.my/index.php/e-ltpa Or you can go to http://imk.unimap.edu.my >>> Online Application Menu (On the Right) >>> Click icon e-LTPAhttp://imk.unimap.edu.my/index.php/e-ltpa http://imk.unimap.edu.my
 >>> Click icon e-LTPAhttp://imk.unimap.edu.my/index.php/e-ltpa")
48
THE END GOOD LUCK FOR YOUR FINAL……..

Similar presentations


>")


