Download presentation
Presentation is loading. Please wait.

1
Susan Sylvester Department Director Operations Control Department Mechanics of the Primary Water Management System

2
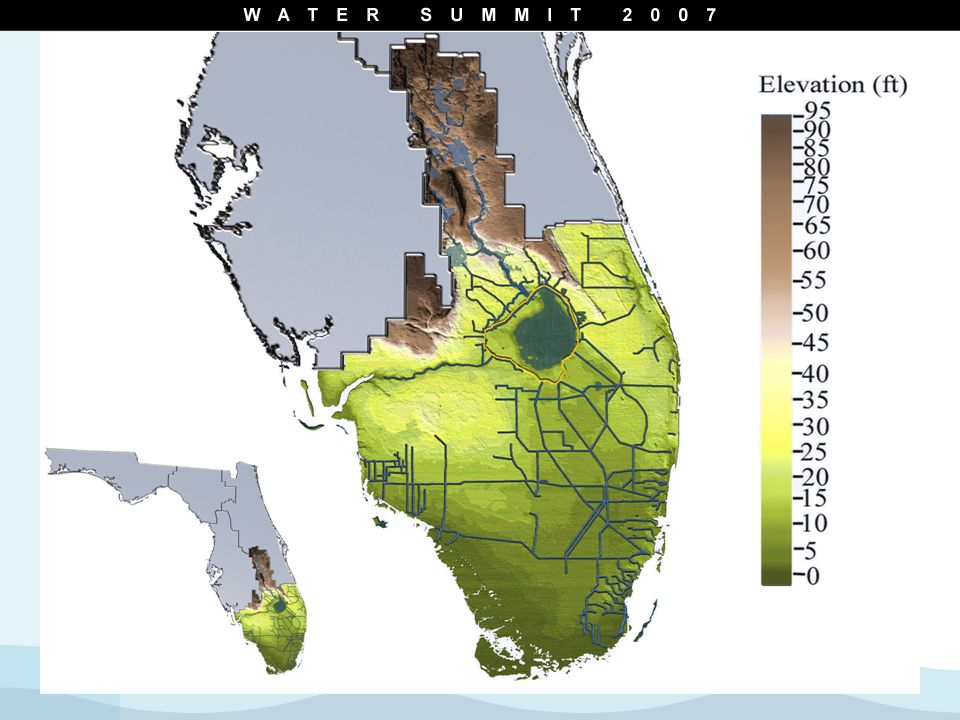
Water Management (Storage and Conveyance) Lakes Water Conservation Areas Canals and Levees Water Control Structures
 Lakes Water Conservation Areas Canals and Levees Water Control Structures")
3
Operable Culverts113 Spillways 59 Pump Stations15 Weirs Numbers are approximate and change as structures are added or retired. Water Control Structures

4
Seasonal Variation of South Florida Rainfall Average Monthly Rainfall 1965-1995 Wet inches months Dry Approximate Pan Evaporation

5
Rainfall above and below the average annual rainfall for 20 stations in South Florida, 1895-1990 (National Climate Center Data). Annual Variation of South Florida Rainfall

7
Hydraulic Gradient Based on Historical Average Stage (CH 2. SFER 2007) 0 10 20 30 40 50 60 050100150200250300 Distance in miles (Lake Tohopekaliga to Florida Bay) Water surface elevation (ft. NGVD) Lake Kissimmee Lake Okeechobee EAA WCA 3 ENP STAs Lake Tohopekaliga FL Bay WCA 1 WCA 2
 Distance in miles (Lake Tohopekaliga to Florida Bay) Water surface elevation (ft. NGVD) Lake Kissimmee Lake Okeechobee EAA WCA 3 ENP STAs Lake Tohopekaliga FL Bay WCA 1 WCA 2.")
8
160 Drainage Basins Composed of linked areas that water managers think of as “Water Control Units”

9
Federal and State Responsibilities

10
Basis of Design and Operation USACE Design Memorandums Engineering basis of design USACE Master Water Control Manuals Define specific operational criteria Based on the Design Memoranda “Central and Southern Florida Project for Flood Control and Other Purposes” Initially authorized in 1948 Constructed between 1950s and 1970s Operated in accordance with USACE criteria USACE SFWMD

11
How operational decisions are made

12
55 Miles per Hour What is a Regulation Schedule? 0 MPH 20 MPH 30 MPH 40 MPH 1st Gear 2nd Gear 3rd Gear 4th Gear SPEED

13
What is a Regulation Schedule? 25% 40 % 50 % 100% Zone D Zone C Zone B Zone A Discharge Stage

14
Flood Control Ops: Discharge Normal Ops: No Discharge Kissimmee River Basin – East Lake Tohopekaliga

15
Flood Control Water Shortage Lake Okeechobee Regulation Schedule

16
Kissimmee Fisheating Creek (Uncontrolled) & C-5 Inflows & Outflows Lake Okeechobee Nubbin Slough Taylor Creek C-41A, C-40 & C-41 S-308 St Lucie may inflow if Lake is < 14.5 S-2 & S-3 under large rainfall may pump to Lake S-135 Inflow capacity exceeds outflow capacity S-77 S-354 C-10 S-351 S-352 Lake Okeechobee's drainage basin covers more than 4,600 square miles 80% East & West 20% South
 & C-5 Inflows & Outflows Lake Okeechobee Nubbin Slough Taylor Creek C-41A, C-40 & C-41 S-308 St Lucie may inflow if Lake is < 14.5 S-2 & S-3 under large rainfall may pump to Lake S-135 Inflow capacity exceeds outflow capacity S-77 S-354 C-10 S-351 S-352 Lake Okeechobee s drainage basin covers more than 4,600 square miles 80% East & West 20% South")
17
Lake Release at S-77 Lake Release at S-308 C-43 Basin Runoff C-44 Basin Runoff Typical Lake Okeechobee & Estuary Flows During Wet Periods S-79 Discharge to Caloosahatchee Estuary Lake Inflows S-80 Discharge to St. Lucie Estuary EAA Runoff Lake Release through EAA to WCAs (via STAs) &/or to tide
 &/or to tide.")
18
Kissimmee Inflows Other Inflows Rain LOSA Water Supply Regulatory to Estuaries ET Regulatory to WCAs Estimated Lake Okeechobee Annual Water Budget

19
For Ecological Sustainability: 12.5 to 15.5 ft-NGVD For Dike Stability: < 18.0 ft-NGVD Deep Pelagic Zone (Elevation < 10’) Littoral Wetland (Elevation 11-15’) Submerged Grass Beds (Elevation 10-12’) 12-15.5’ variation = healthy littoral and submerged grass beds Top of Dike (Elevation 32.3 – 45.6’) Not to Scale Ranges of water levels
 Littoral Wetland (Elevation 11-15’) Submerged Grass Beds (Elevation 10-12’) ’ variation = healthy littoral and submerged grass beds Top of Dike (Elevation 32.3 – 45.6’) Not to Scale Ranges of water levels")
20
Historical Daily Lake Okeechobee Water Level

22
Average Storage in Lakes and Water Conservation Areas

23
Other Area Flow Patterns

24
Everglades Agricultural Area Flow Patterns Original C&SF Operations WCA-1 WCA-2A WCA-3A Lake Okeechobee EAA S-8 S-7 S-6 S-5AS-3S-2 C&SF Project design discharged runoff from the northern portion of the EAA to Lake Okeechobee Only the southern EAA discharged runoff to the WCAs Average annual runoff from the EAA is about 1 million acre feet

25
Everglades Agricultural Area Flow Patterns WCA-1 WCA-2A WCA-3A Lake Okeechobee EAA S-8 S-7 S-6 S-5AS-3S-2 In early 1980s, the District implemented the “Interim Action Plan” Focused most EAA runoff to the WCAs in an effort to reduce nutrient impacts to Lake Okeechobee Additional EAA runoff discharged to the WCAs under the IAP is between 200,000 and 300,000 ac-ft Backpumping to the lake is now primarily used to avoid flooding in the EAA Interim Action Plan

26
Everglades Protection Area Flow Patterns Levees surround the Water Conservation Areas Primary inflow sources EAA Drainage Lake Okeechobee Flood control discharge Water supply to Lower East Coast Major structures move excess water south Smaller structures can discharge some excess water to the ocean Provide water supply to maintain coastal canals WCA-1 WCA-2A WCA-3A WCA-3B ENP Lake Okeechobee EAA

27
Regional System Supplemental Water Supply Everglades Agricultural Area Lake Okeechobee Lower East Coast Service Areas WCAs Lake Okeechobee Everglades National Park WCAs Lake Okeechobee WCA-1 WCA-2A WCA-3A WCA-3B ENP Lake Okeechobee EAA WCA 2B LEC SERVICE AREAS

28
Urban Drainage Elements Conveyance - Canals, Ditches, Structures Protection - Levees Storage - Groundwater, Lakes, Wetlands, Reservoirs Levee Schematic Underlying Limestone Water Conservation Area Levee Hydrostatic Pressure

29
Canal stages held high to facilitate groundwater recharge and assist supplemental irrigation Low groundwater levels due to low, dry season rainfall Groundwater Canals serve two primary purposes…. 1. Flood Control 2. Water Supply Canals serve two primary purposes…. 1. Flood Control 2. Water Supply Canal / Groundwater Interaction Normal Dry Season Operations

30
Canal / Groundwater Interaction Normal Wet Season Operations Canal stages held lower to facilitate surface drainage of urban & agriculture lands Groundwater

31
Canal / Groundwater Interaction Pre-Storm Drawdown Operations Canal stages lowered an about another 1 foot to increase surface drainage of urban & agricultural lands in response to forecasted storms Short-term lowering of canal stages does not significantly decrease regional groundwater levels Groundwater

32
Natural Area & Conveyance System Canal Water Conservation Area Urban Area Levee Long-term low canal stages can depress natural groundwater levels Groundwater

33
Water Management Extremes

34
Questions?

Similar presentations


 Watershed>")


 Taylor Dixon, Hydrologist February 12, 2014.>")

