Download presentation
Presentation is loading. Please wait.

1
Sec. 1.1 CHAPTER 1 SCIENCE SKILLS

2
What is Science? Science is a system of knowledge and the methods that you use to find that knowledge

3
Branches of Science Physical Science Earth and Space Science Life Science (Biology) PhysicsChemistryAstronomyGeology Science EcologyGeneticsZoologyBotany
 PhysicsChemistryAstronomyGeology Science EcologyGeneticsZoologyBotany")
4
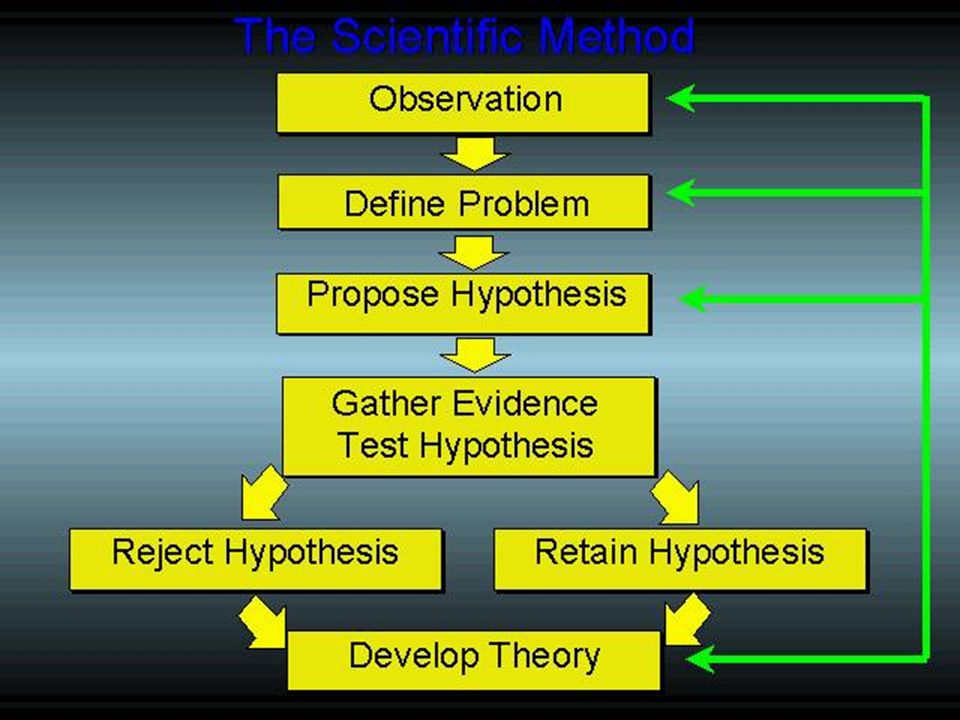
Sec. 1.2 The Scientific Method WHAT IS IT? A set of steps used to solve problems or understand an event that is observed.

5
The STEPS 1. State the PROBLEM or ask a QUESTION based on an OBSERVATION 2. Make a PREDICTION by forming a HYPOTHESIS.

6
Hypothesis: An educated guess. It includes a reason for your prediction.

7
3. Design and perform an EXPERIMENT.

8
4. Analyze the RESULTS (any math, notes, and data collected) 5. Form a CONCLUSION using your analysis. - Ask new questions, REDESIGN your experiment, etc.

10
Scientific Theory When a hypothesis is supported in repeated experiments, scientists develop a: Scientific Theory: a well-tested explanation for a set of observations or experimental results (theories are not proven – only become stronger)
")
11
Scientific Law Scientific Law: describes an observed pattern in nature without attempting to explain it. (explanation is provided by a scientific theory)
.")
12
CHARACTERISTICS OF WELL DESIGNED EXPERIMENTS…

13
A. ONLY one independent variable = controlled experiment INDEPENDENT VARIABLE: what you are in control of, what you manipulate (change) DEPENDENT VARIABLE: what you are measuring, what you are testing
 DEPENDENT VARIABLE: what you are measuring, what you are testing.")
14
B. Repeated trials C. Numbered steps D. Written like a recipe.

15
E. Data is gathered, recorded, and presented so that it is readable and makes sense to others.

16
Sec. 1.4 PRESENTING SCIENTIFIC DATA

17
DATA: exists as two types QUANTITATIVE: expressed as numbers, not words Ex: The table is 1 meter long QUALITATIVE: expressed as words, not numbers Ex: The table is made of wood

18
ORGANIZING DATA: can be organized two ways TABLE GRAPH

19
Tables Must Include: Title Labels for columns Straight lines Container Size Number of Marshmallows Small75 Medium103 Large127 Number or Marshmallows for Different Container Sizes

20
Tables What is wrong with this table?

21
Graphs There are three types of Graphs: –L–Line Graph –B–Bar Graph –C–Circle (Pie) Graph
 Graph")
22
VARIABLES (bar and line graphs) INDEPENDENT: What you change x-axis DEPENDENT: What you measure y-axis
 INDEPENDENT: What you change x-axis DEPENDENT: What you measure y-axis")
23
Write your Hypothesis using your Variables If Ind. Var. is related to Dep. Var. then expected outcome. Fill in the underlined areas

24
Line Graph Best for showing changes in related variable MUST INCLUDE: –Appropriate numbers on each axis –Title –Label for each axis –Unit for each axis

25
Line Graph What is wrong with this graph?

26
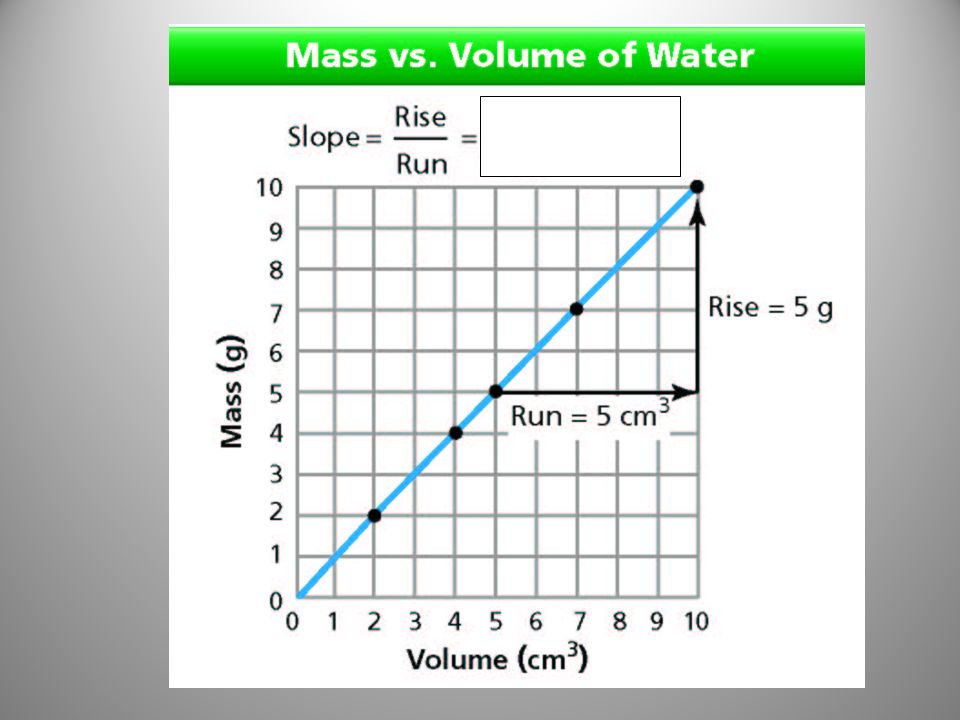
SLOPE ratio between vertical change and horizontal change. SLOPE = RISE RUN

28
Relationships between DATA Direct proportion: The ratio of the two variables is constant Graph is a straight line Ex: 1 gumball then, 2 gumballs and 3 gumballs 2 g 4 g6 g Positive Negative

29
DIRECT / POSITIVE

30
DIRECT / NEGATIVE

31
Relationships between DATA Inverse proportion: The product (multiplication) of the two variables is constant Graph is NOT a straight line Positive Negative
 of the two variables is constant Graph is NOT a straight line Positive Negative")
32
Inverse/Positive

33
Inverse/Negative

34
Bar Graph Best for comparing measurements or amounts MUST INCLUDE: Title Label for each axis Appropriate numbers or words on each axis Units on each axis (if appropriate)
")
35
Bar Graph What is wrong with this graph?

36
Circle (Pie) Graph Best for showing parts of a whole MUST INCLUDE: Title Labels for each pie piece Percent for each pie piece
 Graph Best for showing parts of a whole MUST INCLUDE: Title Labels for each pie piece Percent for each pie piece")
37
What is wrong with this circle graph?

38
Sec. 1.3 SCIENTIFIC MEASUREMENT

39
International System of Units (SI) - STANDARD system of measurement WHY USE SI UNITS? - To speak the SAME LANGUAGE - Compare and analyze data the same way all over the world

40
THE METRIC SYSTEM - Based on 10 - Each unit in the metric system is TEN TIMES LARGER or TEN TIMES SMALLER than its neighbor.

41
PREFIXES KILO=1000 times larger HECTO=100 times larger DEKA=10 times larger BASE UNIT DECI=10 times smaller CENTI=100 times smaller MILLI=1000 times smaller

42
Acrostic – length (m) Kids (KILO) Have (HECTO) Dark (DEKA) Mittens (BASE UNIT - Meter) During (DECI) Cold (CENTI) Months (MILLI)
 Kids (KILO) Have (HECTO) Dark (DEKA) Mittens (BASE UNIT - Meter) During (DECI) Cold (CENTI) Months (MILLI)")
43
Acrostic – time (s) Kathy (KILO) Hit (HECTO) Dear (DEKA) Sister (BASE UNIT - Seconds) During (DECI) Church (CENTI) Mass (MILLI)
 Kathy (KILO) Hit (HECTO) Dear (DEKA) Sister (BASE UNIT - Seconds) During (DECI) Church (CENTI) Mass (MILLI)")
44
Base Units SI built on 7 base units DISTANCE = Length Between two points Measured in METERS Meterm Kilometerkm Decimeter dm Hectometerhm Centimeter cm Dekameterdam Millimeter mm

45
MASS: amount of MATTER (stuff) in an object; this NEVER CHANGES, it remains constant Mass and weight are NOT the same. Measured in Grams Gramg Kilogramkg Decigram dg Hecto gram hg Centigram cg Dekagramdag Milligram mg

46
GRAVITY DEPENDS UPON: DISTANCE BETWEEN two objects and the SIZE of objects WEIGHT: Measure of ATTRACTION BETWEEN TWO OBJECTS DUE TO GRAVITY. This CAN CHANGE, it does not remain constant

47
TIME Measured in SECONDS Seconds Kilosecondks Hectosecondhs Dekaseconddas Decisecondds Centisecondcs Millisecondms

48
Derived Units Made from combinations of base units Volume = amount of space an object takes up Volume of a solid = m 3 » Length x Width x Height » m x m x m » m 3 Volume of a liquid = Liters (L) 1 ml = 1 cm 3 Liter L Kiloliter kL Deciliter dL Hectoliter hL Centiliter cL Dekaliter daLMilliliter mL
 1 ml = 1 cm 3 Liter L Kiloliter kL Deciliter dL Hectoliter hL Centiliter cL Dekaliter daLMilliliter mL")
49
Density = Mass _g__ Volume = mL Derived Units Measured in GRAMS per Milliliter

50
Metric Conversions Kilo Hecto Deca Base Deci Centi Milli k h da d c m To convert: To convert: Count the number of steps between pre-fixes. Move that number of decimal places in the same direction

51
Metric Conversions 1. Convert 12cm to hm 2. Convert 8450s to ks 3. Convert 7kg to cg 4. Convert 64dg to mm

52
TEMPERATURE Measured in Kelvins (K) Temperature Conversions: K = ºC + 273 ºC = 5/9 (ºF – 32) ºF = 9/5(ºC) + 32 Fahrenheit (ºF)Celsius (ºC)Kelvin (K) 212100373 320273 Water Boils Water Freezes
 Temperature Conversions: K = ºC ºC = 5/9 (ºF – 32) ºF = 9/5(ºC) + 32 Fahrenheit (ºF)Celsius (ºC)Kelvin (K) Water Boils Water Freezes")
53
Temperature Conversions 1. Convert 435K to ºC 2. Convert 56ºC to K 3. Convert 75ºF to C 4. Convert 45ºF to K

Similar presentations


 – Official name of the metric system. –>")


 Science - knowledge attained through study or practice or knowledge covering general truths of.>")


