Download presentation
Presentation is loading. Please wait.

1
WCPSS Student Achievement Evaluation and Research Dept. August 19, 2008

2
EOG Results Mathematics proficiency improved for the second consecutive year, from 76% to 78% of WCPSS students scoring proficient. Reading proficiency will not be known until November. Standards are being revised this year.

3
Number of Tested Students (EOG Math, Grades 3-8) All Students American Indian Asian Black/ African American Hispanic/ Latino Multi- racial White FRLLEPSWD 2005-0654,7681442,63714,9214,9082,02230,13616,4352,8688,093 2006-0757,4551562,96815,2915,7072,37330,96017,2983,5657,664 2007-0859,9391733,34515,7226,4662,68931,54418,1224,2277,524
 All Students American Indian Asian Black/ African American Hispanic/ Latino Multi- racial White FRLLEPSWD , ,63714,9214,9082,02230,13616,4352,8688, , ,96815,2915,7072,37330,96017,2983,5657, , ,34515,7226,4662,68931,54418,1224,2277,524")
6
Characteristics of Non-Proficient Students, (EOG Math, Grades 3-8) 13,204 students 52% Male 78% non-Caucasian 15% LEP 28% SWD 61% FRL 33% absent 10 days or more
 13,204 students 52% Male 78% non-Caucasian 15% LEP 28% SWD 61% FRL 33% absent 10 days or more")
7
Characteristics of Non-Proficient Students, (EOG Math, Grades 3-8) 13,204 students is equal to the enrollment of 19 WCPSS elementary schools of average size or 14.5 WCPSS middle schools of average size
 13,204 students is equal to the enrollment of 19 WCPSS elementary schools of average size or 14.5 WCPSS middle schools of average size")
8
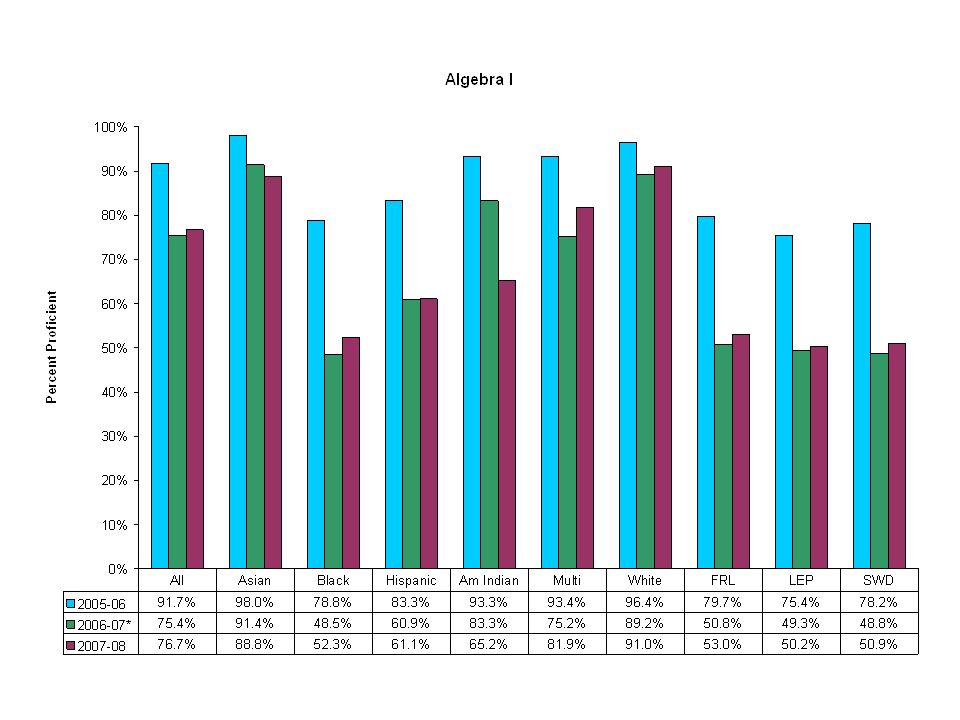
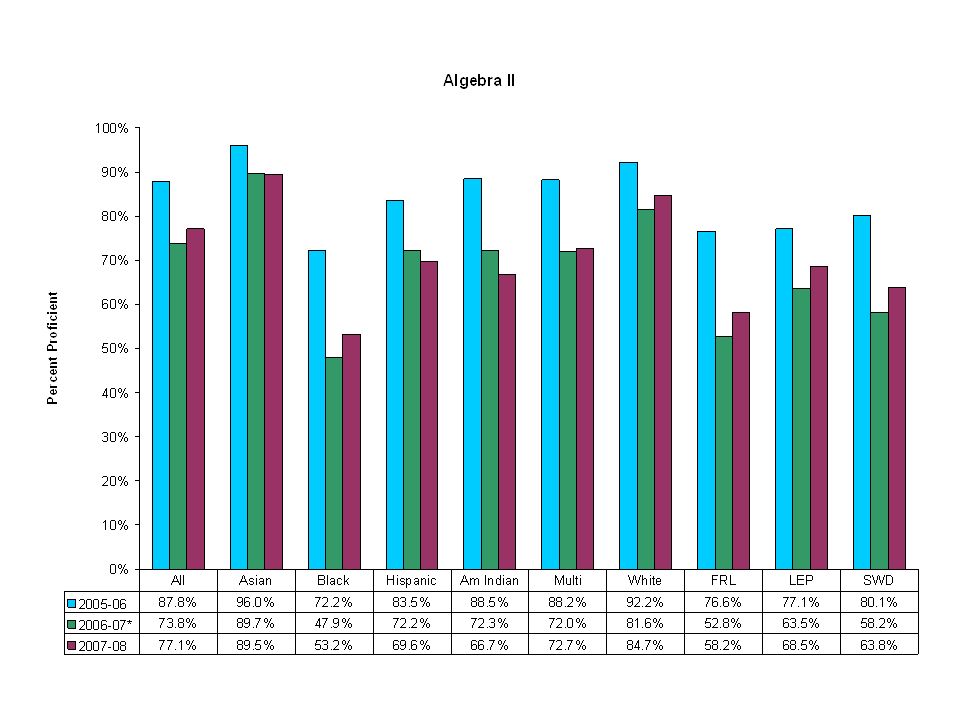
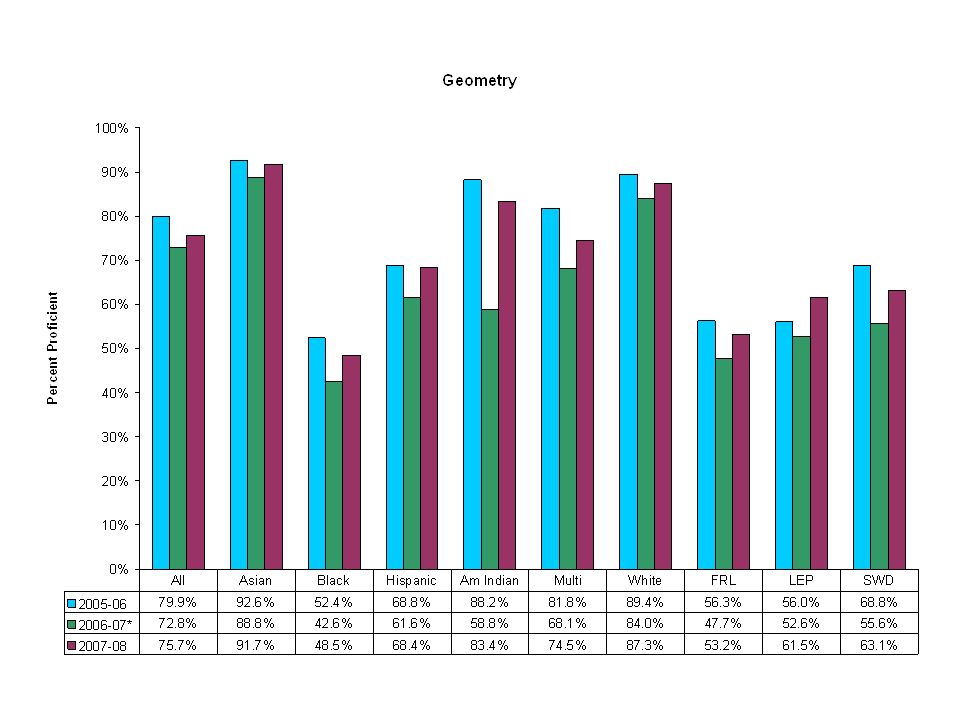
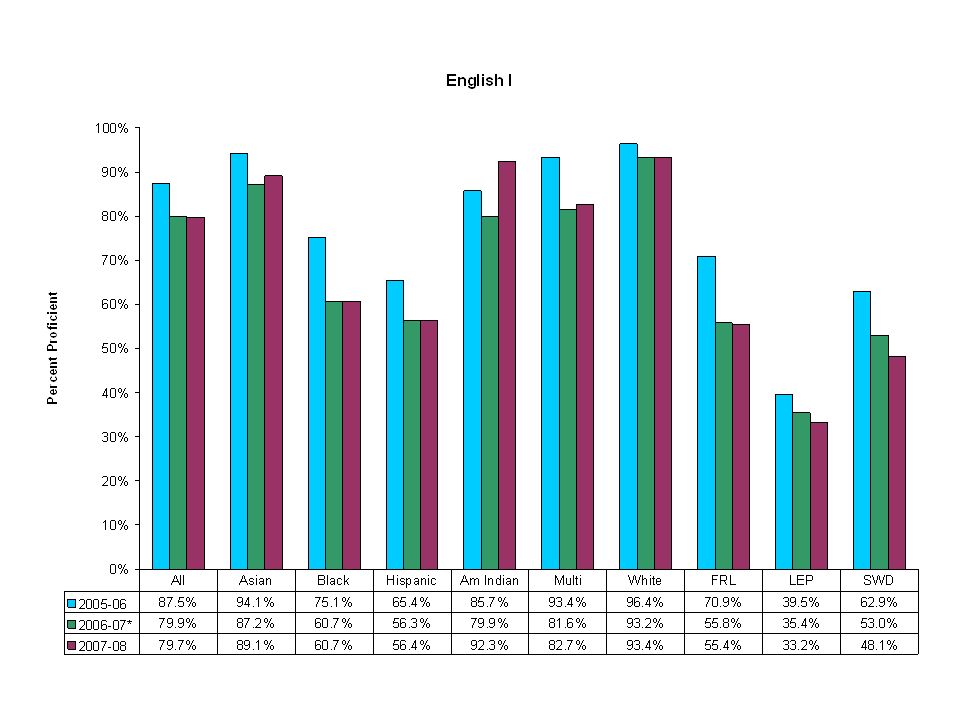
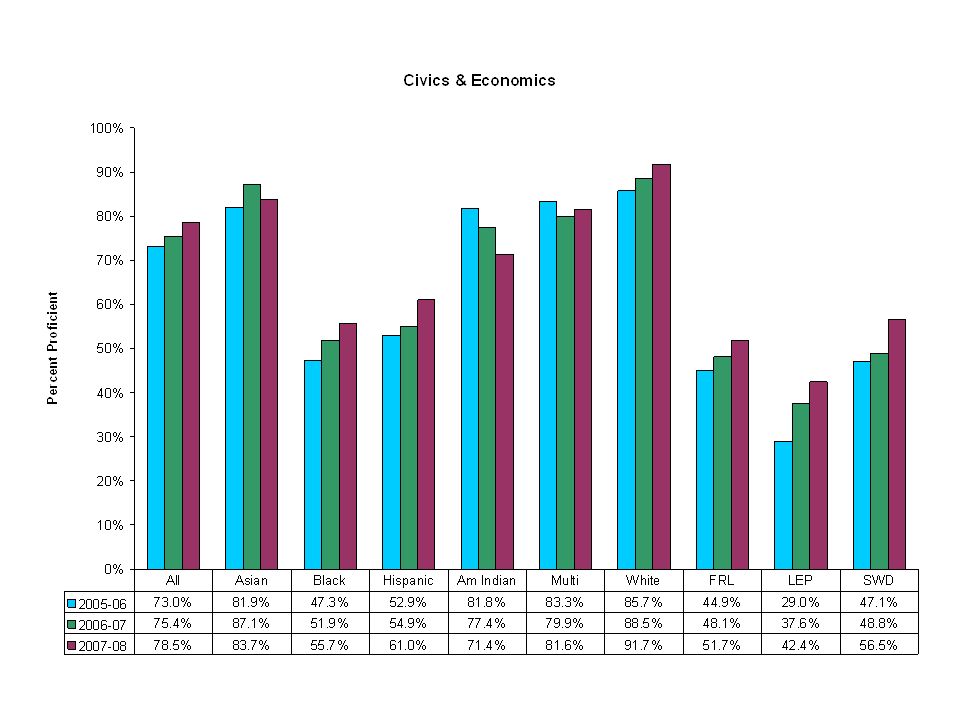
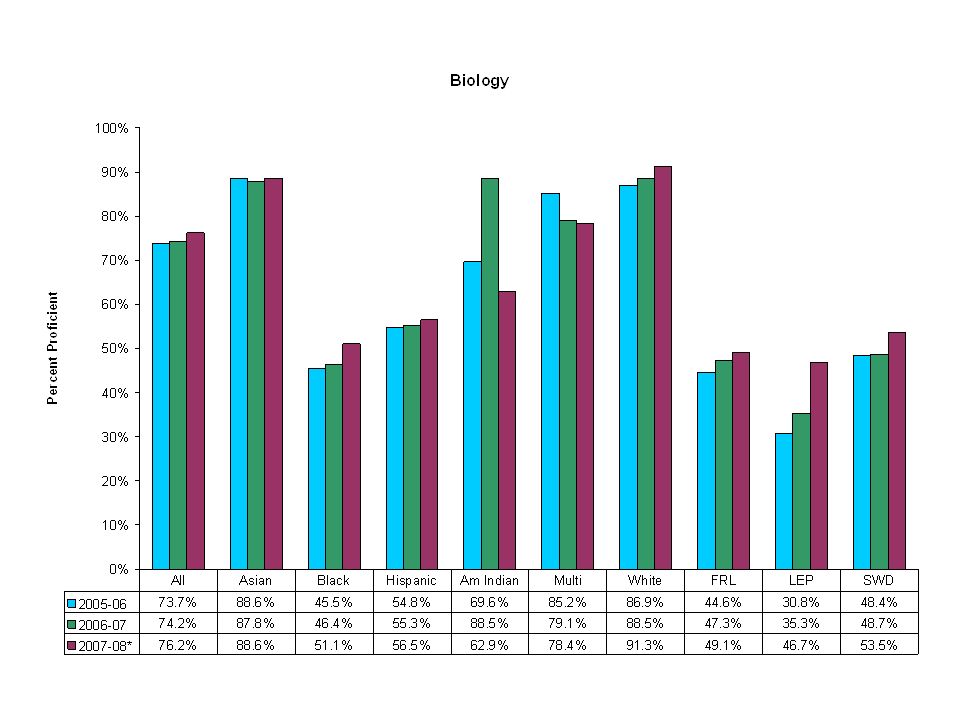
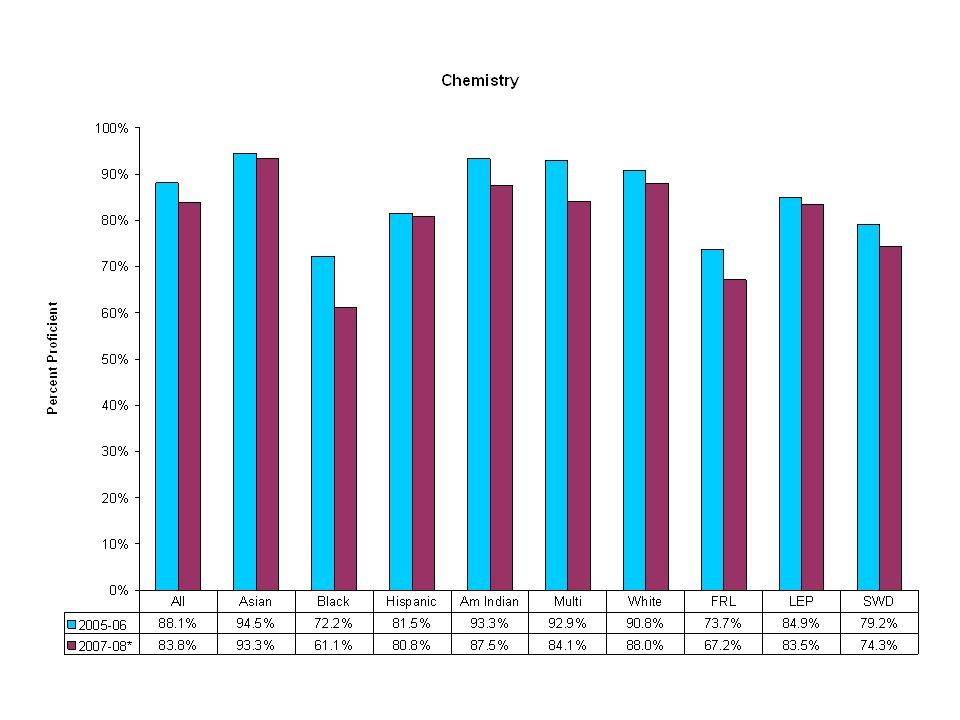
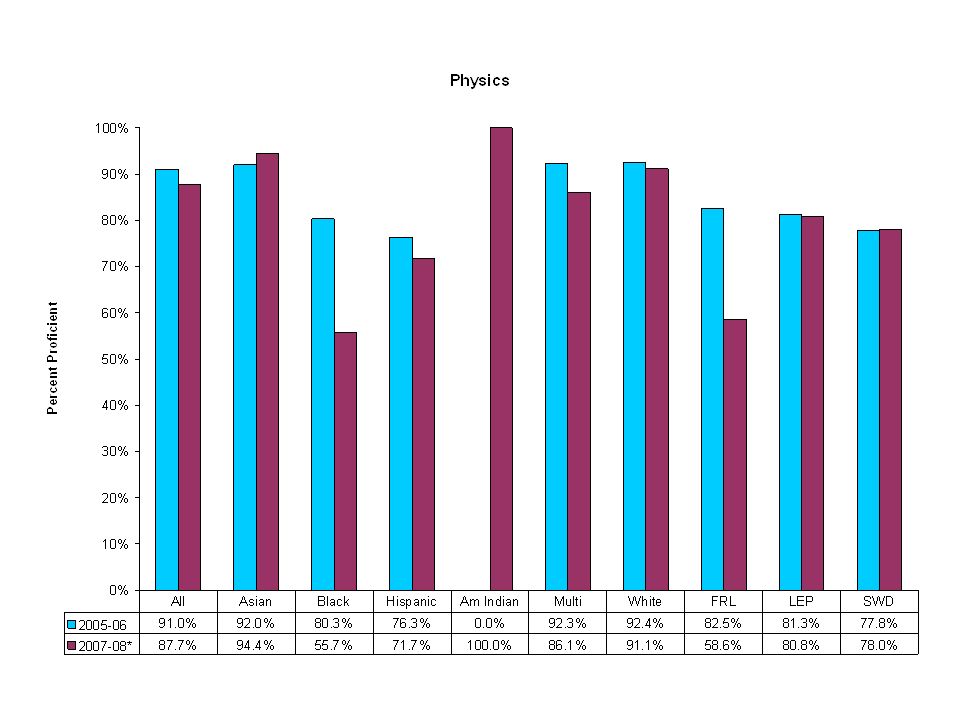
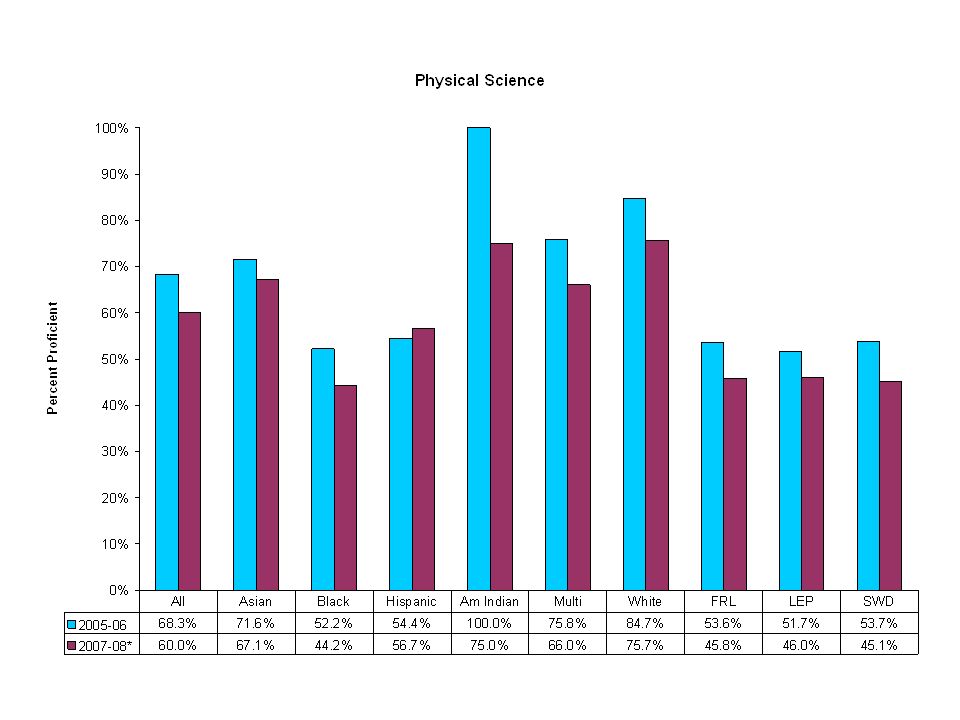
EOC Trends Four tests were re-normed in 2007-08: Biology, Chemistry, Physics, and Physical Science. Proficiency declined slightly in all except Biology. US History and Civics and Economics both improved for the second consecutive year. Of the four tests that were re-normed in 2006-07, three (Algebra I, Algebra II, Geometry) showed improvement in 2007-08, while one (English I) remained stable.
 showed improvement in , while one (English I) remained stable..")
9
Number of Tested Students (English I EOC) All Students American Indian Asian Black/ African American Hispanic/ Latino Multi- racial White FRLLEPSWD 2005-069,404284042,7247162435,2802,2684081,398 2006-079,603134392,8817652675,2252,3714861,314 2007-0810,238274703,1008733545,4142,6905681,364
 All Students American Indian Asian Black/ African American Hispanic/ Latino Multi- racial White FRLLEPSWD , , ,2802, , , , ,2252, , , , ,4142, ,364")
22
ABCs of Public Education: 83 Schools met High Growth 44 Schools met Expected Growth High Growth: Elementary—62 Middle—19 High—2 Expected: Elementary—28 Middle—8 High—7

23
Adequate Yearly Progress (AYP) 37 Schools met AYP 29 Schools missed AYP by 1 target 27 Schools missed AYP by 2 targets
 37 Schools met AYP 29 Schools missed AYP by 1 target 27 Schools missed AYP by 2 targets")
Similar presentations


 Federal Accountability August 0 – 100, A – F One per school (includes a breakdown by grade band) Two Components:>")
 & CAHSEE 2009-10 Results Update Prepared for the September 21, 2010 Board of Education.>")
 who are Proficient in Reading/ELA.>")

 Results Lodi Unified School District Prepared by the Assessment, Research, and Evaluation August 17, 2010 Board Study.>")


