Download presentation
Presentation is loading. Please wait.

1
1 Joint Drafting Group on State of the Environment and Eionet Workshop 13/14 November 2006 EEA Copenhagen

2
2 Task 3 – Scope of SOER parameters

3
3 Comments received after 4 th drafting group meeting in September Comments received from 8 MSs (AT, BE, DE, DK, FI, FR, NL, SE) Comments taken into account in versions being discussed at this workshop
 Comments taken into account in versions being discussed at this workshop")
4
4 Comments on Task 3 Significant changes Common understanding on monitoring site, station, point: short paper distributed for comment to drafting group in October revised version on CIRCA taken up again in Task 4 – interoperability aspects Reporting dates for sheets revised – phased development and implementation of different water categories and quality elements New section (2.4) on “Options for the treatment of data before reporting”
 on Options for the treatment of data before reporting")
5
5 Comments on Task 3 “Quality of data” information considered to be far too detailed by most who commented Now a separate reporting sheet on quality of data Reduction in scope of information requested Information will be used for the Data Quality Index

6
6 Comments on Task 3 Are the limit of detection and limit of determination both required? Supportive determinands and information Why needed? Reported only if available Questions on temporal and spatial aggregation of data aspects Sub-sections on temporal and spatial aggregation of data now combined into new section entitled “Treatment of data before reporting” Changes to other technical comments made where appropriate and agreed

7
7 New version of paper

8
8 Draft Reporting Sheets for SOE data and information Followed approach and structure used by the WFD compliance reporting drafting group 16 drafted 12 of those currently in, or partially in, Eionet-Water and Data Dictionary 16 require future development

9
9

10
10 Sheet structure What should be reported Why it is needed “Look out!” – boxes added to sheets to highlight specific points Common structure on data aspects of sheets Determinands Quality of data Treatment of data before reporting Information on sites used for SOE reporting

11
11 Determinands Bolded when there are “priority” determinands Indication of those not currently in data dictionary

12
12 State of rivers and lakes in terms of nitrogen, phosphorus, chlorophyll-a and organic pollution determinands in water Priority determinands nitrate, total oxidised nitrogen total nitrogen, total phosphorus, orthophosphate, BOD, total organic carbon, total ammonium, chlorophyll a Supportive determinands and information (if available) e.g. pH and temperature Reported annually at site level – or when available if not monitored every year As long a time series as possible for each site

13
13 Quality of data

14
14 State of rivers and lakes in terms of nitrogen, phosphorus, chlorophyll-a and organic pollution determinands in water Treatment of data before reporting Spatial aggregation of data from sub-sites across river if sub-sites are not in areas of significantly different quality Sub-sites can be reported if countries wish to do so (e.g. Danube) Aggregation of data from vertical sub-sites in water column of lake – depth average and surface concentrations Annual and seasonal averages for each site with summary statistics (standard deviation) Or disaggregated, sample data for each site and sub- site
 Aggregation of data from vertical sub-sites in water column of lake – depth average and surface concentrations Annual and seasonal averages for each site with summary statistics (standard deviation) Or disaggregated, sample data for each site and sub- site.")
15
15 Treatment of data before reporting

16
16 Data Dictionary definitions Limit of Detection: Concentration for which there is a desirably small probability (around 5%) that the determinand will not be detected i.e. there is a 95% probability that the determinand will be detected. Limit of Determination The smallest concentration that can be distinguished from the analytical blank at a chosen level of statistical confidence (usually 95%).
..")
17
17 Information of stations used for SOE reporting Meta data or data description on, for example, of data/site aggregation methods Geographic information – in most cases reported under Articles 5 and 8 Physical characteristics- reported only once Proxy pressures – to be derived by EEA and validated by countries – provided only once unless changes

18
18 Section 2 Monitoring stations to obtain representative information for SOE assessments

19
19 2.1EEA Assessments State of, and trends, in the water environment Broader assessments of specific water related issues e.g. eutrophication Assessment of impact of specific sectors (e.g. agriculture) on water, perhaps based on conceptual models such as weighted quality indices EEA aims to make these assessments more representative
 on water, perhaps based on conceptual models such as weighted quality indices EEA aims to make these assessments more representative.")
20
20 2.2Information required for SOE assessments From water bodies covering the full range of statuses and impacted by full range of pressures Probably from stations included in WFD surveillance and operational monitoring Assessments using DPSIR and conceptual frameworks EEA will derive proxy pressure information (country validation) Data and information will be required from other existing sources, particularly on “D” and “R” aspects of assessments
 Data and information will be required from other existing sources, particularly on D and R aspects of assessments")
21
21 Common understanding on monitoring site, station and point in relation to SOER Article 8 reporting sheet introduces concept of “sub-site” “It may be necessary to monitor parameters at a number of sub-sites within a single monitoring site (e.g. to determine profiles of stratification in lakes/reservoirs, transitional and coastal waters or in large rivers (e.g. temperature, oxygen, nutrient or phytoplankton conditions) or to monitor chemical and biological quality elements at different points in one site.)”
 or to monitor chemical and biological quality elements at different points in one site.) .")
22
22 Common understanding on monitoring site, station and point in relation to SOER Monitoring site = monitoring station = monitoring point Site used for the association of SOE data to a specific geographic location Site coordinates reported under Article 8 linked to water body via coordinates and codes reported under Article 5

23
23 Common understanding on monitoring site, station and point in relation to SOER For this guidance Monitoring site/station/point = sampling site/station/point Site may comprise a number of sub-sites Vertically in water column Transects across very wide rivers In immediate vicinity of site Stretches of a water body Aggregation of data from sub-sites may then occur to be representative of principal site

24
24 Common understanding on monitoring site, station and point in relation to SOER If data are aggregated at a national level from a number of sub-sites or sites located horizontally across (as opposed to vertically through) a water body before SOE reporting then the spatial aggregation should not include data from sub-sites or sites that are located in water bodies, or areas of a water body, where quality is significantly different. If this were to be done the subsequent averaging/aggregation of data from the sub sites or sites may not give a representative assessment of the quality of the water body that the site(s) represents.
 represents..")
25
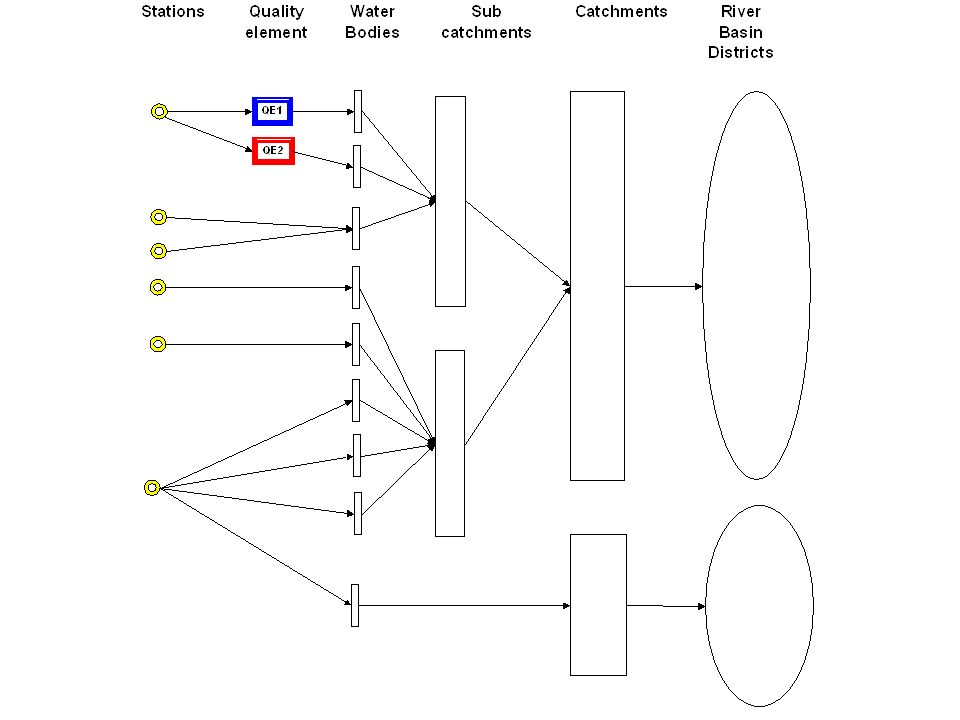
25 2.3Relationship between monitoring sites, determinands measured at the sites and water bodies Data will in principle be reported at the site level Site level data may then be aggregated spatially and/or temporally in ways appropriate for the assessment being undertaken e.g. at water body level Spatial aggregation in coastal and marine waters, and in groundwater Number of different relationships between monitoring stations, quality elements measured at the station and the water bodies they represent

27
27 2.3Relationship between monitoring sites, determinands measured at the site and water bodies Reporting at site level will ensure maximum flexibility in how data are subsequently compiled, aggregated and analysed by the EEA Need supportive and interpretative information on how sites relate to water bodies and groups of water bodies

28
28 2.4 Options for the treatment of data before reporting Vary between reporting sheets Described in sections on “Treatment of data before reporting” Annual/seasonal aggregation of data for each monitoring site with aggregation of data from the sub-sites associated with the site Depth average for deep lakes (with surface values) Width averaged for rivers (with certain conditions) Countries can still report sub-sites if they so-wish (e.g. Danube) Details of aggregation method
 Details of aggregation method.")
29
29 2.4 Options for the treatment of data before reporting Annual/seasonal aggregation of data for each monitoring site with NO aggregation of data from sub-sites Disaggregated, individual sample data for each monitoring site and sub-site

30
30 2.5 Surface waters: Criteria for the monitoring sites to be used for EEA/SOE assessments Distribution and number to provide a representative assessment of the overall status of rivers, lakes, transitional and coastal waters within each catchment and subcatchments within each river basin district in the country, preferably apportioned according to the main pressures that determine the status.

31
31 2.5 Surface waters: Criteria for the monitoring sites to be used for EEA/SOE assessments Representative monitoring sites covering All water categories (rivers, lakes, transitional, coastal and marine waters) All types of water body Complete range of statuses present All sizes All types of pressure Different sites for different quality elements Sites may be from surveillance, operational and other monitoring networks Annual monitoring may be undertaken at the sites for some of the determinands
 All types of water body Complete range of statuses present All sizes All types of pressure Different sites for different quality elements Sites may be from surveillance, operational and other monitoring networks Annual monitoring may be undertaken at the sites for some of the determinands")
32
32 2.6 Surface waters: Additional information to specify criteria Monitoring sites representative of the significant pressures within each catchment and subcatchment. If possible, the sites/water bodies used will be subject to only one significant pressure Operational monitoring sites or from other networks Time-series may be variable Additional meta information on the significant pressure Indicative list of pressures from Article 5 compliance reporting sheet

33
33 2.7 Groundwater: Criteria for the monitoring sites to be used for EEA/SOE assessments distribution and number of monitoring sites used should provide a coherent and comprehensive overview of groundwater chemical and quantitative status within each river basin and aquifer catchment and, to detect the presence of long-term anthropogenically-induced upward/downward trends in pollution. Will be associated with a groundwater body and/or a group of groundwater bodies, and will provide representative information of the state of the water body(ies).
..")
34
34 2.7 Groundwater: Criteria for the monitoring sites to be used for EEA/SOE assessments Relevant groundwater bodies for Eionet- Water met at least 1 of 3 criteria > 300 km² in area; of regional, socio-economic or environmental importance in terms of quantity and quality; exposed to severe or major impacts, representing different possible pressures. No explicit WFD guidance on how GW bodies should be delineated Proposed that SOER should be from all monitoring sites established for WFD and located in groundwater bodies that meet at least one of the Eionet-water criteria

35
35 Informal information and discussion document on statistical aspects of current Eionet-water data submissions

36
36 Number of Eionet-water stations to determine national mean concentrations of different determinands Question: Is the average quality in one country better or worse than another? Country benchmarking

37
37 Orthophosphate 2003: mean of site means with 90% confidence limits

38
38 National mean orthophosphate concentrations in rivers Comparison of concentrations between countries Face-value classification Differences between the countries could be statistically tested for significance Site grand means for BE and GB, and DK and EE are not significantly different, Whereas those for CZ and HU, and CS and BG are significantly different at the 95 % level of confidence

39
39 Number of years data required to detect linear trends in determinand concentrations with different levels of confidence Questions: Are things getting better or worse? How soon do we want to know? How sure are we that real changes are occurring?

40
40 Number of years required to detect linear trends in orthophosphate - mean of national site mean concentrations with 90% confidence

41
41 Number of years data required to detect linear trends in determinand concentrations with different levels of confidence Only relatively big changes in grand mean concentrations would be detectable within a few years, and Smaller changes would take longer to detect. In Denmark a 10 % linear change in mean orthophosphate concentration a year would be detectable in around 2 years with a 90% confidence Whereas a 2 % change a year would be detectable in 6 years

42
42 How representative are data from Eionet stations of quality in individual catchments?

43
43 Eionet and GQA stations in Thames catchment and in England and Wales: Nitrate 2000, mean of site means with 95% confidence limits 111931538912Sites:

44
44 How representative are data from Eionet stations of quality in individual catchments? Current Eionet stations in Thames catchment are not fully representative of the Thames catchment in terms of nitrate concentrations in rivers Current Eionet stations would be representative of the average situation in England and Wales in terms of nitrate concentrations in rivers.

45
45 Rivers: Difference in numbers of surveillance monitoring and Eionet-Water sites

46
46 Lakes: Difference in numbers of surveillance monitoring and Eionet-Water sites

47
47 Transitional (T) and Coastal (C) Waters: Difference in numbers of surveillance monitoring and Eionet-Water sites
 and Coastal (C) Waters: Difference in numbers of surveillance monitoring and Eionet-Water sites")
48
48 Eionet-Water: Monitoring sites in marine water with no category designation

49
49 Discussion of Task 3 Monitoring stations to obtain representative information for SOE assessments

50
50 Task 3: Section 3 Draft Reporting Sheets for SOE data and information Sheets for surface water combined sheets for rivers and lakes, and combined sheets for transitional and coastal waters Sheets for marine waters to be discussed with EMMA group

51
51 Draft Reporting Sheets for SOE data and information 16 drafted 12 of those currently in, or partially in, Eionet-Water and Data Dictionary 16 require future development

52
52 Draft reporting sheets for rivers and lakes (those in red in Eionet-Water/Data Dictionary) State of rivers and lakes nitrogen, phosphorus, chlorophyll-a and organic pollution determinands Priority Substances and other hazardous substances in water benthic invertebrate fauna - rivers Phytoplankton - lakes other aquatic flora - lakes State and quantity of water resources Loads, discharges and emissions of pollutants to surface waters
 State of rivers and lakes nitrogen, phosphorus, chlorophyll-a and organic pollution determinands Priority Substances and other hazardous substances in water benthic invertebrate fauna - rivers Phytoplankton - lakes other aquatic flora - lakes State and quantity of water resources Loads, discharges and emissions of pollutants to surface waters")
53
53 Draft reporting sheets for groundwater (those in red in Eionet-Water/Data Dictionary) State of groundwaters in terms of nitrogen State of groundwaters in terms of Priority Substances and other hazardous substances
 State of groundwaters in terms of nitrogen State of groundwaters in terms of Priority Substances and other hazardous substances")
54
54 Draft reporting sheets for transitional and coastal waters (those in red in Eionet-Water/Data Dictionary) State of transitional and coastal waters in terms of Nitrogen, phosphorus and chlorophyll-a in water Priority Substances and other hazardous substances in water Priority Substances and other hazardous substances in biota biological quality elements – other aquatic flora (seagrasses)
 State of transitional and coastal waters in terms of Nitrogen, phosphorus and chlorophyll-a in water Priority Substances and other hazardous substances in water Priority Substances and other hazardous substances in biota biological quality elements – other aquatic flora (seagrasses)")
55
55 Draft reporting sheets for geographic, supportive and interpretative information for monitoring stations (those in red in Eionet-Water/Data Dictionary) Surface waters and groundwaters Station characteristics and proxy pressure information Geographic information - some in data dictionary Data Quality – DQI
 Surface waters and groundwaters Station characteristics and proxy pressure information Geographic information - some in data dictionary Data Quality – DQI")
56
56 Treatment of data before reporting For some determinands and water categories disaggregated individual sample data If aggregated data is only possible Annual Summer Winter (hydrological year) One way of treating concentrations less than limit of detection before aggregation Summary statistics of the aggregates Meta information
 One way of treating concentrations less than limit of detection before aggregation Summary statistics of the aggregates Meta information")
57
57 Treatment of data before reporting For each of the monitoring site used for SOE reporting Width averaged aggregation for rivers Depth averaged aggregation for lakes At the groundwater body level if sampling site data not available

58
58 Sheet structure What should be reported Why it is needed “Look out!” – boxes added to sheets to highlight specific points Common structure on data aspects of sheets Determinands Quality of data Treatment of data before reporting Information on sites used for SOE reporting

59
59

60
60 State of rivers and lakes in terms of nitrogen, phosphorus, chlorophyll-a and organic pollution determinands in water Priority determinands nitrate, total oxidised nitrogen total nitrogen, total phosphorus, orthophosphate, BOD, total organic carbon, total ammonium, chlorophyll a Supportive determinands and information (if available) e.g. pH and temperature Reported annually at site level – or when available if not monitored every year As long a time series as possible for each site

61
61 Quality of data

62
62 State of rivers and lakes in terms of nitrogen, phosphorus, chlorophyll-a and organic pollution determinands in water Treatment of data before reporting Spatial aggregation of data from sub-sites across river if sub-sites are not in areas of significantly different quality Sub-sites can be reported if countries wish to do so (e.g. Danube) Aggregation of data from vertical sub-sites in water column of lake – depth average and surface concentrations Annual and seasonal averages for each site with summary statistics (standard deviation) Or disaggregated, sample data for each site and sub- site
 Aggregation of data from vertical sub-sites in water column of lake – depth average and surface concentrations Annual and seasonal averages for each site with summary statistics (standard deviation) Or disaggregated, sample data for each site and sub- site.")
63
63 Treatment of data before reporting

64
64 Information of stations used for SOE reporting Meta data or data description on, for example, of data/site aggregation methods Geographic information – in most cases reported under Articles 5 and 8 Physical characteristics- reported only once Proxy pressures – to be derived by EEA and validated by countries – provided only once unless changes

65
65 State of rivers and lakes in terms of Priority Substances and other hazardous substances in water Determinands: WFD Priority Substances and other significant chemical pollutants Supportive determinands and information (if available) e.g. pH and water hardness Disaggregated, sample data for each monitoring site Indication as to whether sub-site data has been aggregated

66
66 State of rivers and lakes in terms of Priority Substances and other hazardous substances in water

67
67 State of rivers and lakes in terms of Priority Substances and other hazardous substances in water Fraction analysed Limit of detection (LoD) Limit of determination (if limit of detection not available Guidance on how concentrations at LoD should be reported
 Limit of determination (if limit of detection not available Guidance on how concentrations at LoD should be reported")
68
68 State and quantity of surface water resources Why is it needed? EEA indicators Use of freshwater resources/water exploitation index Ways of producing comparable estimates of annual renewable water resources to be discussed between EEA and EUROSTAT Development of new statistics for inland water assessments Assessment of riverine fluxes In relation to climate change, floods and droughts

69
69 State and quantity of surface water resources River discharge data Daily data for subset of representative stations Monthly averages and other summary statistics for representative stations Long-term statistics: e.g. distribution of return frequencies Representative selection of national stations (1 gauging station per 200 to 1000 km 2 Subset of representative stations (between 15 and 25 % of representative stations)
.")
70
70 Loads, discharges and emissions of pollutants to surface waters For the development of indicators of emissions for the assessment of pressures and state Loads of identified pollutants emitted from point and diffuse sources and transferred to surface water bodies, catchments and river basin districts Sheet proposes an interim method will be developed taking into account streamlining of data flows and incorporation into WISE including reporting of pressures for WFD, UWWT Directive, EPER, E-PRTR and ESTAT/OECD joint questionnaire

71
71 Loads, discharges and emissions of pollutants to surface waters Nutrients (N and P), organic matter (TOC, BOD or COD) and Priority Substances Reported in terms of an assessment unit Geographically aggregated areas Preferably catchments around 5000 km 2 Maybe administrative units such as NUTS2 or 3 Later maybe water body level For defined categories (e.g urban) of point and diffuse sources Data description such as aggregation methods Geographic and characteristics information on each assessment unit – provided once
, organic matter (TOC, BOD or COD) and Priority Substances Reported in terms of an assessment unit Geographically aggregated areas Preferably catchments around 5000 km 2 Maybe administrative units such as NUTS2 or 3 Later maybe water body level For defined categories (e.g urban) of point and diffuse sources Data description such as aggregation methods Geographic and characteristics information on each assessment unit – provided once")
72
72 State of river water bodies in terms of benthic invertebrate fauna The value of the national summary metric/aggregated index for each site and sampling occasion derived from, for example, the measured number of taxa and abundance, and taxa sensitivity data The equivalent national classification result for each sample and site Meta data or data description with details of metric and indices used for summarising and reporting the composition and abundance of the river benthic invertebrate fauna (If available) indication of expected value of the measured metric at the site – eventually reference conditions
 indication of expected value of the measured metric at the site – eventually reference conditions")
73
73 State of river water bodies in terms of benthic invertebrate fauna

74
74 State of river water bodies in terms of benthic invertebrate fauna Reported annually when measured every year When not, in the year they become available As long a time series as possible for each site

75
75 State of lake water bodies in terms of phytoplankton Total phytoplankton biomass at each lake site Total cyanobacteria biomass at each lake site Chlorophyll a (reported in sheet 1) Annual and summer average values for each site Depth averaged and surface values Meta data/information – depth of sampling, details of methods, aggregation etc.
 Annual and summer average values for each site Depth averaged and surface values Meta data/information – depth of sampling, details of methods, aggregation etc.")
76
76 State of lake water bodies in terms of other aquatic flora (macrophytes) Macrophyte coverage (% of the entire bottom area) – water body level Depth limit (maximum colonisation depth) Average values at the time of maximum biomass (~September-October) Detailed description of macrophyte survey method – reported once, unless changed
 Macrophyte coverage (% of the entire bottom area) – water body level Depth limit (maximum colonisation depth) Average values at the time of maximum biomass (~September-October) Detailed description of macrophyte survey method – reported once, unless changed")
77
77 State of groundwater in terms of nitrogen Priority determinands: nitrate, total ammonium, oxygen Supportive determinands and information (if available) e.g. nitrite, pH and conductivity Reported annually at site level or groundwater body – or when available if not monitored every year As long a time series as possible for each site/groundwater body

78
78 State of groundwater in terms of nitrogen Treatment of data before reporting Disaggregated: concentrations in each sample and sampling at each monitoring site in the groundwater body – preferred option Aggregated: annual average concentrations for the groundwater body Treatment of limits of detection (or determination)
")
79
79 State of groundwater in terms of Priority Substances and other hazardous substances Determinands: Priority Substances and other significant pollutants

80
80 State of groundwater in terms of Priority Substances and other hazardous substances Treatment of data before reporting Disaggregated: concentrations in each sample and sampling at each monitoring site in the groundwater body Preferred option

81
81 State of transitional and coastal waters in terms of nitrogen, phosphorus, oxygen and chlorophyll-a in water Priority determinands: nitrate, total oxidised nitrogen total nitrogen, total phosphorus, orthophosphate, chlorophyll a, oxygen concentration and saturation, salinity Supportive determinands and information (if available) e.g. temperature and silicate

82
82 State of transitional and coastal waters in terms of nitrogen, phosphorus, oxygen and chlorophyll-a in water Treatment of data before reporting Preferred option is for disaggregated, individual sample data for each monitoring site/sub-site Treatment of data after reporting, calculation of: Summer, winter and annual mean concentrations Surface and bottom average concentrations Representative spatial averages for sites with variable coordinates

83
83 State of transitional and coastal waters in terms of Priority Substances and other hazardous substances in water and biota Priority substances and other significant chemical pollutants Supportive information (if available) e.g. Biota: species, tissue, size Water: salinity, fraction analysed

84
84 State of transitional and coastal waters in terms of Priority Substances and other hazardous substances in water and biota Treatment of data before reporting Preferred option is for disaggregated, individual sample data for each monitoring site/sub-site used for SOE reporting Limits of detection (or determination)
")
85
85 State of transitional and coastal water bodies in terms of other aquatic flora (seagrasses) Use of seagrasses is also proposed for the Streamlining European 2010 Biodiversity Indicators (SEBI2010) initiative Composition (species) and abundance (numbers of individuals) of seagrasses [Note: ~6 Pan-European species] Seagrass coverage (% of the water body); Depth limit (maximum colonisation depth) Aggregated/average value for water body for time of maximum biomass and development Detailed description of survey method – reported once, unless changed
![85 State of transitional and coastal water bodies in terms of other aquatic flora (seagrasses) Use of seagrasses is also proposed for the Streamlining European 2010 Biodiversity Indicators (SEBI2010) initiative Composition (species) and abundance (numbers of individuals) of seagrasses [Note: ~6 Pan-European species] Seagrass coverage (% of the water body); Depth limit (maximum colonisation depth) Aggregated/average value for water body for time of maximum biomass and development Detailed description of survey method – reported once, unless changed](http://images.slideplayer.com/31/9788357/slides/slide_85.jpg "85 State of transitional and coastal water bodies in terms of other aquatic flora (seagrasses) Use of seagrasses is also proposed for the Streamlining European 2010 Biodiversity Indicators (SEBI2010) initiative Composition (species) and abundance (numbers of individuals) of seagrasses [Note: ~6 Pan-European species] Seagrass coverage (% of the water body); Depth limit (maximum colonisation depth) Aggregated/average value for water body for time of maximum biomass and development Detailed description of survey method – reported once, unless changed")
86
86 Site characteristics and proxy pressure information Physical characteristics of monitoring site Provided once unless there are changes Name/unique identity code of monitoring site as reported for Article 8 with links to water body(ies)
")
87
87 Site characteristics – for typology Catchment area upstream of river monitoring site, and/or of the water body Catchment area of lake water body Altitude Surface area and average depth of lake water body Average width and depth of river at monitoring site Long term average river flow Predominant upstream catchment geology Residence time of the lake water body alkalinity and conductivity (lakes)
")
88
88 Site characteristics and proxy pressure information Proxy pressure information arising from inland sources will be derived by the EEA Countries will be asked to validate this information Some information on human activities affecting water bodies also requested

89
89 Geographic information Monitoring sites Links to compliance reporting sheets on monitoring (Article 8) for site location through unique site code – need not be reported again for SOE However will be required for those sites included in SOER but not in WFD monitoring networks
 for site location through unique site code – need not be reported again for SOE However will be required for those sites included in SOER but not in WFD monitoring networks")
90
90 Geographic information Unique site code linked to unique water body code and unique codes for each water body within a group Article 5 All water bodies Unique code Coordinates of centroid of water body Shape/GML files of the water bodies

91
91 Geographic information Site information required from countries where SOER monitoring sites not included in WFD monitoring programmes Where they do not report compliance information to the European Commission (also water body information)
")
92
92 Draft reporting sheet on “Data Quality for reported SOE Data” Generic sheet produced as a result of comments from last SOE group meeting – less detailed Information on analytical methods and on QA/QC procedures associated with sampling/monitoring, analysis and data screening Requested every 4 years or when national changes For each relevant regional or national monitoring programme providing SOE data Information used to derive Data Quality Index

93
93 Data Quality for reported SOE Data Monitoring programme Name and/or identifier Water Category(ies) monitored Determinands monitored Meta data (yes/no answers) is requested on the following aspects for each monitoring programme identified above
 monitored Determinands monitored Meta data (yes/no answers) is requested on the following aspects for each monitoring programme identified above")
94
94 Data Quality for reported SOE Data Training of staff for sampling (and any field measurements) Accreditation of analytical laboratories by a national accreditation body External auditing of laboratories Definition of numerical accuracy requirements Laboratory performance test data Laboratory production of routine quality control charts Linkage to routine and regular interlaboratory tests Screening of monitoring data
 Accreditation of analytical laboratories by a national accreditation body External auditing of laboratories Definition of numerical accuracy requirements Laboratory performance test data Laboratory production of routine quality control charts Linkage to routine and regular interlaboratory tests Screening of monitoring data")
95
95 Data Quality for reported SOE Data Analytical methods used Determinand name; CAS number of determinand (where appropriate); CEN/ISO code of the method(s) used: Name of method used when there is no CEN/ISO standard method or when the CEN/ISO standard method has not been used.
; CEN/ISO code of the method(s) used: Name of method used when there is no CEN/ISO standard method or when the CEN/ISO standard method has not been used.")
96
96 Data Quality for reported SOE Data

97
97 Task 3: Discussion on reporting sheets

98
98 Further Tasks Task 4: Guidance on data processing, handling and reporting Task 5: Requirements for technical integration

Similar presentations