Download presentation
Presentation is loading. Please wait.

1
An Overview of HPC Winter Weather Guidance for Three Warning Criteria Snowfall Events That Occurred During the 2007-2008 Winter Season. A Review of the Goree/Younkin/Brown Snowfall Forecasting Technique: Case Study Jim Sieveking Winter Weather Workshop November 19 th 2008

2
Contents Review of Internal HPC Winter Weather Products Review of HPC Guidance for three warning snowfall events 15 December 2007 31 January - 1 February 2008 3-4 March 2008 How to Properly Use HPC Guidance A Review of the Goree/Younkin/Brown Snowfall Forecasting Technique Case Study Using Weather Event Simulator (WES)
")
3
HPC Internal Winter Weather Guidance

4
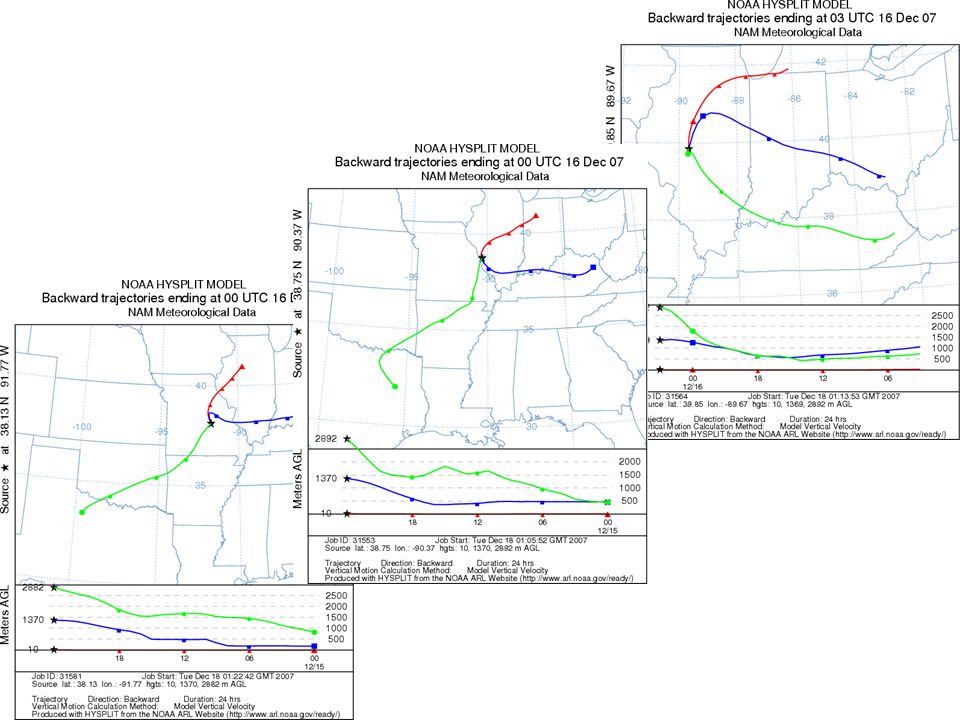
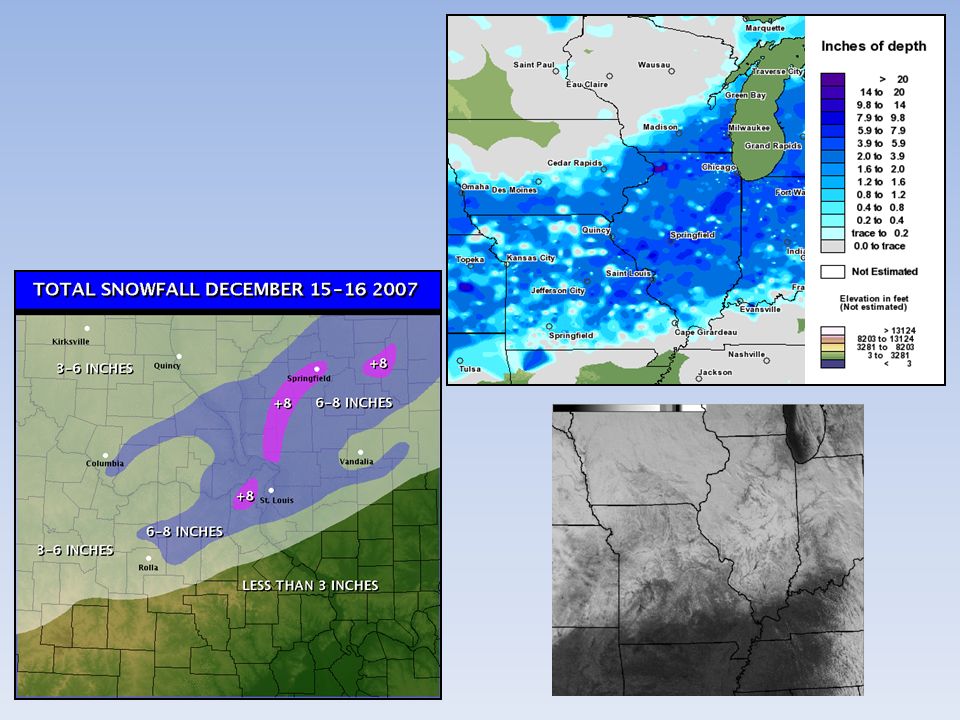
12-15-2007 Winter Storm Event Review

5
Surface Low Track 12 UTC 15 December 2007 12 UTC 16 December 2007

6
Surface Map 00:00Z 16 December 2007

7
500mb Upper Air Analysis 12 UTC 15 December 200712 UTC 16 December 2007 L

8
850mb Upper Air Analysis 00:00Z 16 December 2007

9
700mb Upper Air Analysis 00:00Z 16 December 2007

11
DAY 2 DAY 3 DAY 2+3 HPC WWD GUIDANCE 06:00 UTC THURSDAY 12/13/07 DAY 2 = 12:00 UTC Friday - 12:00 UTC Saturday DAY 3 = 12:00 UTC Saturday - 12:00 UTC Sunday DAY 2+3 = 12:00 UTC Friday - 12:00 UTC Sunday

12
DAY 2+3 HPC WWD GUIDANCE 18:00 UTC THURSDAY 12/13/07 DAY 2 = 00:00 UTC Saturday - 00:00 UTC Sunday DAY 3 = 00:00 UTC Sunday - 00:00 UTC Monday DAY 2+3 = 00:00 UTC Saturday - 00:00 UTC Monday DAY 2 DAY 3 DAY 2+3

13
HPC WWD GUIDANCE 06:00 UTC FRIDAY 12/14/07 DAY 1 = 12:00 UTC Friday - 12:00 UTC Saturday DAY 2 = 12:00 UTC Saturday - 12:00 UTC Sunday DAY 1+2 = 12:00 UTC Friday - 12:00 UTC Sunday DAY 1 DAY 2 DAY 1+2

14
DAY 2+3 HPC WWD GUIDANCE 18:00 UTC FRIDAY 12/14/07 DAY 1 = 00:00 UTC Saturday - 00:00 UTC Sunday DAY 2 = 00:00 UTC Sunday - 00:00 UTC Monday DAY 1+2 = 00:00 UTC Saturday - 00:00 UTC Monday DAY 1+2 DAY 1 DAY 2 DAY 1+2

15
HPC WWD GUIDANCE 06:00 UTC SATURDAY 12/15/07 DAY 1 = 12:00 UTC Saturday - 12:00 UTC Sunday DAY 1

16
HPC WWD GUIDANCE 18:00 UTC SATURDAY 12/15/07 DAY 1 = 00:00 UTC Sunday - 00:00 UTC Monday DAY 1

18
1-31-2008 Winter Storm Event Review

19
Surface Low Track 12 UTC 31 January 2008 12 UTC 1 February 2008

20
500mb Upper Air Analysis 12 UTC 31 January 200812 UTC 1 February 2008 L

21
850mb Upper Air Analysis L 00 UTC 1 February 2008

22
DAY 2 DAY 3 DAY 2+3 HPC WWD GUIDANCE 06:00 UTC TUESDAY 01/29/08 DAY 2 = 12:00 UTC Wednesday - 12:00 UTC Thurs DAY 3 = 12:00 UTC Thursday - 12:00 UTC Friday DAY 2+3 = 12:00 UTC Wednesday - 12:00 UTC Friday

23
DAY 2+3 HPC WWD GUIDANCE 18:00 UTC TUESDAY 01/29/08 DAY 2 = 00:00 UTC Thursday - 00:00 UTC Friday DAY 3 = 00:00 UTC Friday - 00:00 UTC Saturday DAY 2+3 = 00:00 UTC Thursday - 00:00 UTC Saturday DAY 2 DAY 3 DAY 2+3

24
HPC WWD GUIDANCE 06:00 UTC Wednesday 01/30/08 DAY 1 = 12:00 UTC Wednesday - 12:00 UTC Thur DAY 2 = 12:00 UTC Thursday - 12:00 UTC Friday DAY 1+2 = 12:00 UTC Wednesday - 12:00 UTC Friday DAY 1 DAY 2 DAY 1+2

25
DAY 2+3 HPC WWD GUIDANCE 18:00 UTC Wednesday 01/30/08 DAY 1 = 00:00 UTC Thursday - 00:00 UTC Friday DAY 2 = 00:00 UTC Friday - 00:00 UTC Saturday DAY 1+2 = 00:00 UTC Thursday - 00:00 UTC Saturday DAY 1+2 DAY 1 DAY 2 DAY 1+2

26
HPC WWD GUIDANCE 06:00 UTC THURSDAY 01/31/08 DAY 1 = 12:00 UTC Thursday - 12:00 UTC Friday DAY 1

27
HPC WWD GUIDANCE 18:00 UTC THURSDAY 01/31/08 DAY 1 = 00:00 UTC Friday - 00:00 UTC Saturday DAY 1

28
Total Snowfall 1 February 2008

29
3-4-2008 Winter Storm Event Review

30
Surface Low Track 12 UTC 3 March 2008 12 UTC 4 March 2008

31
500mb Upper Air Analysis 12 UTC 3 March 2008 12 UTC 4 March 2008 L

32
850mb Upper Air Analysis L 12 UTC 4 March 2008

33
DAY 2 DAY 3 DAY 2+3 HPC WWD GUIDANCE 06:00 UTC SATURDAY 03/01/08 DAY 2 = 12:00 UTC Sunday - 12:00 UTC Monday DAY 3 = 12:00 UTC Monday - 12:00 UTC Tuesday DAY 2+3 = 12:00 UTC Sunday - 12:00 UTC Tuesday

34
DAY 2+3 HPC WWD GUIDANCE 18:00 UTC SATURDAY 03/01/08 DAY 2 = 00:00 UTC Monday - 00:00 UTC Tuesday DAY 3 = 00:00 UTC Tuesday - 00:00 UTC Wednesday DAY 2+3 = 00:00 UTC Monday - 00:00 UTC Wed DAY 2 DAY 3 DAY 2+3

35
HPC WWD GUIDANCE 06:00 UTC SUNDAY 03/02/08 DAY 2 = 12:00 UTC Monday - 12:00 UTC Tuesday DAY 3 = 12:00 UTC Tuesday - 12:00 UTC Wednesday DAY 2+3 = 12:00 UTC Monday - 12:00 UTC Wed DAY 2 DAY 3 DAY 2+3

36
HPC WWD GUIDANCE 18:00 UTC SUNDAY 03/02/08 DAY 1 = 00:00 UTC Monday - 00:00 UTC Tuesday DAY 2 = 00:00 UTC Tuesday - 00:00 UTC Wednesday DAY 1+2 = 00:00 UTC Monday - 00:00 UTC Wed DAY 1 DAY 2 DAY 1+2

37
DAY 2+3 HPC WWD GUIDANCE 06:00 UTC Monday 03/03/08 DAY 1 = 12:00 UTC Monday - 12:00 UTC Tuesday DAY 2 = 12:00 UTC Tuesday - 12:00 UTC Wednesday DAY 1+2 = 12:00 UTC Monday - 12:00 UTC Wed DAY 1+2 DAY 1 DAY 2 DAY 1+2

38
HPC WWD GUIDANCE 18:00 UTC MONDAY 03/03/08 DAY 1 = 00:00 UTC Tuesday - 00:00 UTC Wednesday DAY 1

39
HPC WWD GUIDANCE 06:00 UTC Tuesday 03/04/08 DAY 1 = 12:00 UTC Tuesday - 12:00 UTC Wednesday DAY 1

40
0.25-0.50” ICE ACCUMULATION >0.25” ICE ACCUMULATION 0.5” SLEET ACCUMULATION Less Than 3 Inches 3 - 6 Inches 6 -9 Inches 9 – 12 Inches Greater Than 12 Inches Snowfall Accumulation March 3-4 2008 Winter Storm Accumulation St. Louis Farmington Salem Godfrey Steelville Virden Greenville Red Bud

41
How To Properly Use HPC Guidance

42
WINTER FORECASTING GUIDANCE GFS SREF HPC Winter Weather Products ECWMF NAM WRF CANADIAN COLLABORATION

43
WFO FORECAST ≠ HPC GUIDANCE Use HPC winter weather products as GUIDANCE! Understand HPC’s weaknesses

44
HPC Forecast Consistency? Flip Flop

45
WWD BLENDER “{2007/12/13 04:50} hpc_wwd: I used a blend of: 12z ecwmf 12z ecwmf ensemble mean 21z srefmean 00z canadian regional gem draft hpc qpf 12z nam 12z gfs, and nam/srefmean/ecwmf for thermal profiles.”

46
HPC Blender Approach Just Click On Status To See the Concoction HPC WWD forecaster used the following blend as a starting point grid: NOTE: Each component in the blend was given equal weighting Day 1 graphic last updated at Mon Nov 3 16:13:13 UTC 2008 using the following blend settings: QPF BLEND 12Z GFS %40 12Z NAM %30 00Z ECM %30 PTYPE BLEND 12Z GFS %20 12Z NAM %50 09Z SREF Mean %30

47
HPC Blender Approach NAM ECWMF GFS 3 6 3 3 6 6 1 1 1 2 2 2 CAUTION: This approach often leads to an unrealistic snowfall forecast, with increased areal coverage and lower snowfall amounts than what actually verifies. This approach is heavily biased toward model QPF. 33% OF EACH

48
Beware of the HPC East Coast Bias

49
Heavy Snowfall Forecasting Technique Goree/Younkin/Brown Goree, P.A., and R.J.Younkin, 1966: Synoptic Climatology of Heavy Snowfall over the Central and Eastern United States. Monthly Weather Review, 94, 11, 663-668. Brown, R.F., and R.J. Younkin, 1970: Some Relationships Between 850-Millibar Lows and Heavy Snow Occurrences Over the Central and Eastern United States. Monthly Weather Review, 98,5, 399-401.

50
Goree and Younkin (1966) study contained a data set for two winter seasons – which supplied them with 50 winter storm events that: Produced heavy snow (4 inches in 12 hours) over a 14,384nm 2 area. Were associated with deepening and occluding surface low-pressure systems. Had a movement of the 500mb vorticity maxima in a direction north of east (44 of the 50 cases) Brown and Younkin (1970) study contained a data set for two winter seasons – which supplied them with 81 winter storm events that: Produced heavy snow (4 inches in 12 hours) over a 17,982nm 2 area. Had a discernable 850mb low center that moved northeast and deepened during the 12hr heavy snowfall event Heavy Snowfall Forecasting Technique Goree/Younkin/Brown So let us assume for this technique to properly work, you must have: 1.A 500mb vorticity maxima that is moving northeast 2.A deepening/occluding surface low pressure system 3.A discernable 850 low center that tracks northeast and deepens with time 4.Thermal profile is conducive for snowfall and moisture is available
 Brown and Younkin (1970) study contained a data set for two winter seasons – which supplied them with 81 winter storm events that: Produced heavy snow (4 inches in 12 hours) over a 17,982nm 2 area. Had a discernable 850mb low center that moved northeast and deepened during the 12hr heavy snowfall event Heavy Snowfall Forecasting Technique Goree/Younkin/Brown So let us assume for this technique to properly work, you must have: 1.A 500mb vorticity maxima that is moving northeast 2.A deepening/occluding surface low pressure system 3.A discernable 850 low center that tracks northeast and deepens with time 4.Thermal profile is conducive for snowfall and moisture is available.")
51
Goree and Younkin, 1966 The most favorable location of heavy snow with respect to the 500mb vorticity maxima is 2.5 Latitude Degrees (~150 Nautical Miles) to the left of its path.
 to the left of its path.")
52
Heavy Snow Occurs: 2.5 Degrees or 150 nm left of the track of the vorticity maxima. Slightly downstream from where the curvature changes from cyclonic to anticyclonic When the 500mb trough or low is deepening Goree and Younkin, 1966

53
Brown and Younkin, 1970 The initial 850mb center of the 12 hour study revealed that the -5°C isotherm nearly bisects the observed subsequent 12-hr heavy snowfall area.

54
Brown and Younkin, 1970 The most favorable location of heavy snow with respect to the 850mb low track is roughly 90 Nautical Miles to the left of its path.

55
Heavy Snow Occurs: 1.5 degrees or 90 nm to the left of the track of the 850mb low When the mean circulation deepens significantly * The “initial” -5°C degree isotherm is a good indicator for heavy snowfall axis in the following 12 hours. Brown and Younkin, 1970

56
Goree/Younkin/Brown Technique Step 1: Plot the track of the 850 mb low pressure. Draw a parallel line 90 nm to the cold side of the track. Step 2: Plot the track of the 500 mb vorticity maximum. Draw a line parallel to this track and 2.5 degrees of latitude (~150nm) to the cold side of the track. Step 3: Evaluate the location of the -5 o C 850 mb temperature compared to the tracks plotted in Steps 1 and 2. Step 4: Assess the warm air advection, lift and moisture available along the track over time. Step 5: Based on the results of Steps 1 through 4, determine the axis of heaviest snowfall and the relative intensity along the track. 90nm 150nm
 to the cold side of the track. Step 3: Evaluate the location of the -5 o C 850 mb temperature compared to the tracks plotted in Steps 1 and 2. Step 4: Assess the warm air advection, lift and moisture available along the track over time. Step 5: Based on the results of Steps 1 through 4, determine the axis of heaviest snowfall and the relative intensity along the track. 90nm 150nm.")
57
Technique Application: Weather Event Simulator Scenario (12Z 31 January 2008) *12-24 Forecast Weather Event Simulator – 500mb Evolution – MSLP Comparison – 850mb Low Track Comparison – 850mb Temperature (Looking for -5°C) – Trowal Structure? – QPF/Snowfall Differences Applying the Empirical Technique – 500mb Vorticity Maxima Track Consensus – 850 Low Track Consensus – 850mb “Initial” Temperature – Compare Technique to HPC and Observed Snowfall

58
500mb Vorticity Maxima

59
850mb Low Track Initial Temperature (°C) At 00Z Feb 1 st
 At 00Z Feb 1 st")
60
Putting It All Together -5°C 0°C

61
HPC Forecast

62
Observed Snowfall

63
You Be The Judge

64
06090120150 Regional Distance Scale 1.5°1.0°2.0°2.5°3.0° 06090120150 Regional Distance Scale 1.5°1.0°2.0°2.5°3.0° 06090120150 Regional Distance Scale 1.5°1.0°2.0°2.5°3.0° 06090120150 Regional Distance Scale 1.5°1.0°2.0°2.5°3.0°

Similar presentations


 Great Lakes Operational Meteorological Workshop Dan Petersen, Wallace.>")


 MSC 243 Lecture #8, 10/22/09.>")


 Hydrometeorlogical Prediction Center (HPC) Forecast Operations Branch Winter Weather Desk Dan Petersen.>")


