Download presentation
Presentation is loading. Please wait.

1
National Centers for Environmental Prediction (NCEP) Hydrometeorlogical Prediction Center (HPC) Forecast Operations Branch Winter Weather Desk Dan Petersen

2
Goals of Presentation Review HPC winter weather desk forecasts and verification Review verification of snow to liquid ratio forecasts Review Short Range Ensemble Forecast Temperature Biases and Upcoming Changes

3
HPC Winter Weather Desk
Issues heavy snow and icing forecasts and collaborates these forecasts with local Weather Forecast offices September 15- May 15 Internal 24-hour Snow and Ice accumulation probability graphics for days one through three. Public and technical versions of low tracks graphic depicting synoptic scale surface low tracks associated with heavy snow or ice. Heavy Snow and Ice Discussion Forecasts and discussions posted at

4
HPC Products and Services Winter Weather Desk Probabilistic Snow Forecasts are issued for 4, 8 and 12 inches, and icing for 0.25 inches

5
HPC Winter Weather Desk Day 3 probabilistic snow forecast verification 2006-8
2007-8 HPC forecaster improvement over Brier skill score for all NCEP model and ensemble members ( top, bottom) 2006-7
")
6
HPC Winter Weather Desk Days 1-3 probabilistic 0
HPC Winter Weather Desk Days 1-3 probabilistic 0.25” ice forecast verification HPC forecaster improvement over Brier skill score for all NCEP model and ensemble members ( top, bottom) 2007-8 2006-7
")
7
HPC Products and Services-Winter Weather Desk Low Tracks Graphic
The displayed model and ensemble low positions show the uncertainty of the low positions- the black line represents the HPC preferred track

8
HPC Products and Services Low track verification 2007-8
ECMWF had lowest rms errors hours, followed by UKMET

9
HPC Winter Weather Forecast Process
Snow accumulations obtained by multiplying experimental snow to liquid ratios times quantitative precipitation forecast (QPF) Experimental ratios blend the UWM (Roebber et al) neural net technique, climatology, and fixed snow to liquid ratios
 Experimental ratios blend the UWM (Roebber et al) neural net technique, climatology, and fixed snow to liquid ratios.")
10
HPC Winter Weather Desk Forecast Process
Climatology of Snow to Liquid Ratios (courtesy Marty Baxter)
")
11
Snow to Liquid Ratio References
The Morphology of Snow Crystals and Crystal Density Snow to Liquid Ratio References Libbrecht,

12
Snow to liquid ratio studies Roebber et al (2003)
Snow ratios determined by temperature, relative humidity, solar radiation (month), and compaction (via wind speed and weight of liquid forcing snow to compress) 10-member ensemble of artificial neural networks assigns snow ratio in one of three classes: heavy (ratio < 9:1), average (9:1 to 15:1), and light (ratio > 15:1).
, and compaction (via wind speed and weight of liquid forcing snow to compress) 10-member ensemble of artificial neural networks assigns snow ratio in one of three classes: heavy (ratio < 9:1), average (9:1 to 15:1), and light (ratio > 15:1).")
13
Real time Web page interface for calculating SLR

14
Role of Vertical Velocity in determining snow ratio?
The maximum growth rate is expected to occur near the level of maximum upward air motion within the cloud, where the greatest water vapor delivery occurs (Auer and White 1982).
.")
15
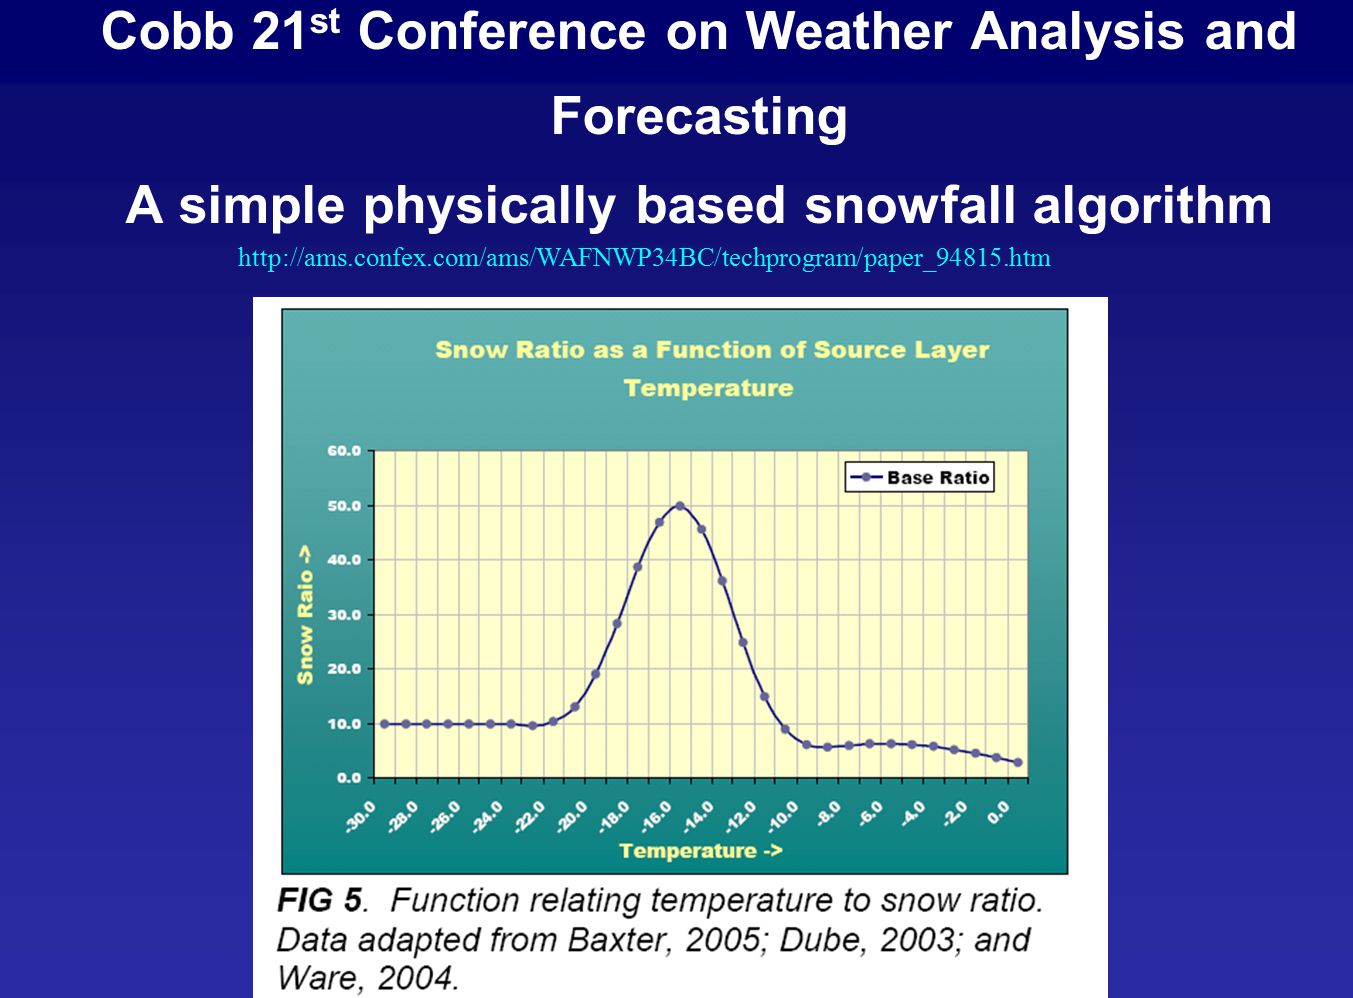
Cobb 21st Conference on Weather Analysis and Forecasting A simple physically based snowfall algorithm
16
Cobb (Caribou) Method SLR is computed for each cloud layer and then weighted towards the layer with the greatest vertical velocity (UVV)
 Method SLR is computed for each cloud layer and then weighted towards the layer with the greatest vertical velocity (UVV)")
17
Verification of the Snow to Liquid Ratio Forecast Tools
Winter and Snow to Liquid Ratio Verification Summary for the SLR methods run using GFS model output and verified against cooperative observer and CoCoRahs reports In this graph, the day one performance of the snow to liquid ratio root mean square errors and the bias of forecasts derived from GFS output are shown. In this case, the bias is the mean of (Forecast-Observed), so a perfect score is zero, and positive values indicate a high forecast bias. Note the current methods show an average error near 4:1, and each has a slightly high bias, with the neural net showing the bias closest to an ideal value. These biases drop to below zero (or have negative biases) on both day two and day three for all methods. Community Collaborative Rain, Hail & Snow Network
, so a perfect score is zero, and positive values indicate a high forecast bias. Note the current methods show an average error near 4:1, and each has a slightly high bias, with the neural net showing the bias closest to an ideal value. These biases drop to below zero (or have negative biases) on both day two and day three for all methods. Community Collaborative Rain, Hail & Snow Network")
18
Verification of the Snow to Liquid Ratio Forecast Tools
Winter and Snow to Liquid Ratio Verification Summary for the SLR methods run using NAM model output The climatological snow to liquid ratios show a higher rms error than the other techniques when the methods are run using the NAM model output. The slightly high bias for the caribou method using the gfs output changes to a low bias using the NAM output. This is possibly due to changes in the NAM’s vertical velocity profile, which is often weaker through the sounding depth than that in the gfs. Each method’s bias continue to decrease on the forecasts for days two and three.

19
Short Range Ensemble Forecast (SREF) Temperature Forecast Issue and Upcoming Changes
Non Hydrostatic Mesoscale Model (NMM) Advanced Research Weather Research Forecast (ARW)
 Advanced Research Weather Research Forecast (ARW)")
20
SREF NMM Member 2m Temperature Bias Dec. 1, 2007-Feb. 29, 2008

21
SREFMean 2m temperature bias Dec. 1, 2007-Feb. 29, 2008
SREFMean (Blue) often the coldest bias vs. the NAM (black) gfs (red), bias corrected srefmean (green) GFS NAM SREFMEAN
 often the coldest bias vs. the NAM (black) gfs (red), bias corrected srefmean (green) GFS. NAM. SREFMEAN.")
22
SREF 2m Temperature upgrade impact:
Increase in WRF to ten members - Non Hydrostatic Mesoscale Model (NMM) increase to five members (if temperature bias uncorrected, would have greater impact on mean) - Advanced Research Weather Research Forecast (ARW) increase to five members
 increase to five members (if temperature bias uncorrected, would have greater impact on mean) - Advanced Research Weather Research Forecast (ARW) increase to five members.")
23
(green line is zero bias)
Mean forecast error of 2m Temp (C) of parallel SREF (left), current operational SREF (right) June The results from the parallel experiment show a slight positive bias the first 48 hours, trending to a slight negative bias hours (green line is zero bias)
 of parallel SREF (left), current operational SREF (right) June The results from the parallel experiment show a slight positive bias the first 48 hours, trending to a slight negative bias hours. (green line is zero bias)")
24
SREF Mean 2m temperature analysis 03z Sun 10/26/08
Area of concern-central to northern Rockies and high Plains

25
2m SREF Mean temperature 84 hr forecast at 03z 10/26/08
84 hour operational forecast shows minima of 0C (red) where no areas analyzed less than 5C
 where no areas analyzed less than 5C.")
26
2m SREF Mean parallel temperature forecast
84 hour parallel SREF forecast shows minima of 5C (still a cold bias but improved over prior SREF by 3-4 degrees C)
")
27
12z Tue. Oct SREF operational (green), parallel (red) 27 hour forecast sea level pressures on left screen, 12z HPC surface analysis (right) Sea level pressures 4-6 mb too high in much of NY-PA-NJ-New England in both operational, parallel sref

28
12z Tue. Oct mb 27 hour forecast sref operational (green), parallel (red) left screen, initial global data assimilation analysis (right) 500 mb low verified near PA-NJ border with both SREF versions showing low near PA-MD border

29
Questions/comments? (301)
")
30
Upcoming SREF changes December 2008
Upgrade both NMM and ARW to version 2.2 and increase their model horizontal resolution from 40/45km to 32km Upgrade RSM model version and increase resolution from 45km to 32km Increase WRF membership from 6 to 10 (5 NMM and 5 ARW) and reduce Eta membership from 10 to 6 Enhance physics diversity among RSM members: replace Zhou cloud scheme with Ferrier scheme for 3 SAS members Increase output frequency from 3hrly to hourly for the 1st 39hr to meet the demand from aviation and convection forecasting Add aviation and wind-variance fields to ensemble products Breakout “big” SREF bufr output into individual stations
 and reduce Eta membership from 10 to 6. Enhance physics diversity among RSM members: replace Zhou cloud scheme with Ferrier scheme for 3 SAS members. Increase output frequency from 3hrly to hourly for the 1st 39hr to meet the demand from aviation and convection forecasting. Add aviation and wind-variance fields to ensemble products. Breakout big SREF bufr output into individual stations.")
31
Short Range Ensemble Forecast (SREF) derived probabilities for snowfall rates, amounts, and precipitation type Select most recent model run, then winter weather option on left Probability of snow as precipitation type for 8 am EDT Friday April

32
SREF Derived Winter Weather Impact Graphics-derived probabilities for snow fall rates, visibilities, and event duration SREF probability of one inch per hour snowfall 00z Friday April

33
SREF Temperature Bias Dec. 1 2007-Feb 29 2008

34
HPC Products and Services Low track verification 2007-8

Similar presentations


 Version 1.0 January 2013.>")
 Great Lakes Operational Meteorological Workshop Dan Petersen, Wallace.>")


 at NCEP HPC Peter C. Manousos NCEP HPC Science & Operations Officer>")