Download presentation
Presentation is loading. Please wait.

2
Expressional and Functional Divergences between Duplicate Genes Wen-Hsiung Li University of Chicago

3
Why study duplicate genes? Gene duplication is the primary source of genetic novelties (Ohno 1970). Genomic (including functional and proteomic) data provide excellent materials for studying the mode, tempo, and mechanisms of the evolution of duplicate genes.
 data provide excellent materials for studying the mode, tempo, and mechanisms of the evolution of duplicate genes..")
4
Origin of trichromacy: Traditional View New World Monkeys Humans Apes Old World Monkeys X chromosomeAutosome ?

5
Evolutionary Fates of Duplicate Genes (1) In the vast majority of cases the extra copy resulted from a gene duplication will become nonfunctional (a pseudogene) because deleterious mutation occurs much more often than advantageous mutation.
 In the vast majority of cases the extra copy resulted from a gene duplication will become nonfunctional (a pseudogene) because deleterious mutation occurs much more often than advantageous mutation.")
6
Evolutionary Fates of Duplicate Genes (2) One way for both copies to be retained in the genome is to diverge in function. The first step for divergence in function is commonly believed to be divergence in expression.

7
Divergence in Expression between Duplicate Genes at the Genomic Level Trends in Genetics, 2002 Zhenglong Gu, Dan Nicolae, Henry Lu and Wen-Hsiung Li

8
Markert, Clement L. (1964) Isozymes: Enzymes from duplicate genes Differences in expression among tissues. Protein electrophoresis.
 Isozymes: Enzymes from duplicate genes Differences in expression among tissues. Protein electrophoresis..")
9
S. Ohno (1970) proposed Expression divergence: A major mechanism for retaining duplicate genes in a genome. The first step in functional divergence. But how often and how fast do duplicate genes diverge in expression?
 proposed Expression divergence: A major mechanism for retaining duplicate genes in a genome. The first step in functional divergence. But how often and how fast do duplicate genes diverge in expression .")
10
Past studies: Limited number of gene families, providing no general picture of the tempo of expression divergence between duplicate genes in a genome. Microarray gene expression technology and complete genome sequencing: a general picture The Yeast Genome

11
Similarity between expression patterns of two genes R = the correlation coefficient of the expression levels of the two genes over different time points of an experiment (a physiological process)
")
12
Wagner, 2000

13
Wagner (2000) PNAS Protein sequence divergence and expression divergence: decoupled It does not imply that expression divergence and evolutionary time are decoupled because protein distance may not be a good proxy of divergence time.
 PNAS Protein sequence divergence and expression divergence: decoupled It does not imply that expression divergence and evolutionary time are decoupled because protein distance may not be a good proxy of divergence time.")
14
Although a protein may evolve at an approximately constant rate over time, the rate of amino acid substitution varies tremendously among proteins, so that a single distance cannot be applied to date the divergence times of different protein (or gene) pairs.
 pairs.")
15
In comparison, the rate of synonymous substitution is more uniform among genes and so synonymous distance (K S ) would be a better proxy of divergence time. We therefore rely more on K S than on protein distance or K A (non- synonymous distance).
..")
16
Detection of Duplicate Genes: Gu et al., MBE 2001 Two proteins belong to the same family: (1) if their similarity (including gaps) is > 30%, and (2) if the total length of the alignable regions is > 80% of the longer protein.
 if their similarity (including gaps) is > 30%, and (2) if the total length of the alignable regions is > 80% of the longer protein.")
17
Selection of Duplicate Genes (1) To avoid using correlated data points, we select independent pairs of duplicate genes in the yeast genome. For each gene family our selection proceeds with increasing K S, because gene pairs with a small K S are fewer than those with a large K S and can more accurately reflect the time course of expression divergence.

18
Selection of Duplicate Genes (2) We require that both duplicate genes do not show strong codon usage bias, which can retard the increase of K S so as to make K S a poor proxy of divergence time.
 We require that both duplicate genes do not show strong codon usage bias, which can retard the increase of K S so as to make K S a poor proxy of divergence time.")
19
Linear regression analysis Since R is bounded by –1 and 1, the transformation ℓn((1+R)/(1-R)) was used. The normal linear regression was then carried out between K S (K A ) and the transformed R.
 and the transformed R..")
20
Data: cDNA microarray expression data 208 points

21
R = -0.47, P = 3.19e-5

22
R = 0.02, P = 0.78 R = -0.52, P = 5.45e-12

23
Data: Affymetrix data 79 points

24
R = -0.42, P =0.005

25
R = -0.42, P =3.17e-6R = -0.07, P =0.37

26
Conclusion A significant negative correlation (-47%, P < 2 ×10 -5 ) between R and K S. So, expression divergence increases with K S and evolutionary time. Expression divergence and K A are initially coupled to some extent.

27
In the above analysis all experiments were considered together, that is, the correlation coefficient R was calculated over all data points. This pooling of data may obscure the relationship between expression divergence and sequence divergence because a pair of duplicate genes may be involved in only some but not all of the physiological processes tested.

28
Note that if a gene pair is not involved in a process, it is unlikely to evolve expression divergence in that process. We now consider R separately for each of the 14 independent tests that we can obtain from current data.

29
Definition of divergent expression: Two duplicate genes are said to have diverged in expression if n or more negative R’s in the 14 processes used are observed. We considered n = 1 and 2.

30
A sliding window analysis was used when the 14 processes used were treated separately. For the gene pairs within the K S (±0.25) or K A (±0.05) window of each studied duplicate gene pair, the proportion of gene pairs with divergent expression is calculated.
 or K A (±0.05) window of each studied duplicate gene pair, the proportion of gene pairs with divergent expression is calculated..")
31
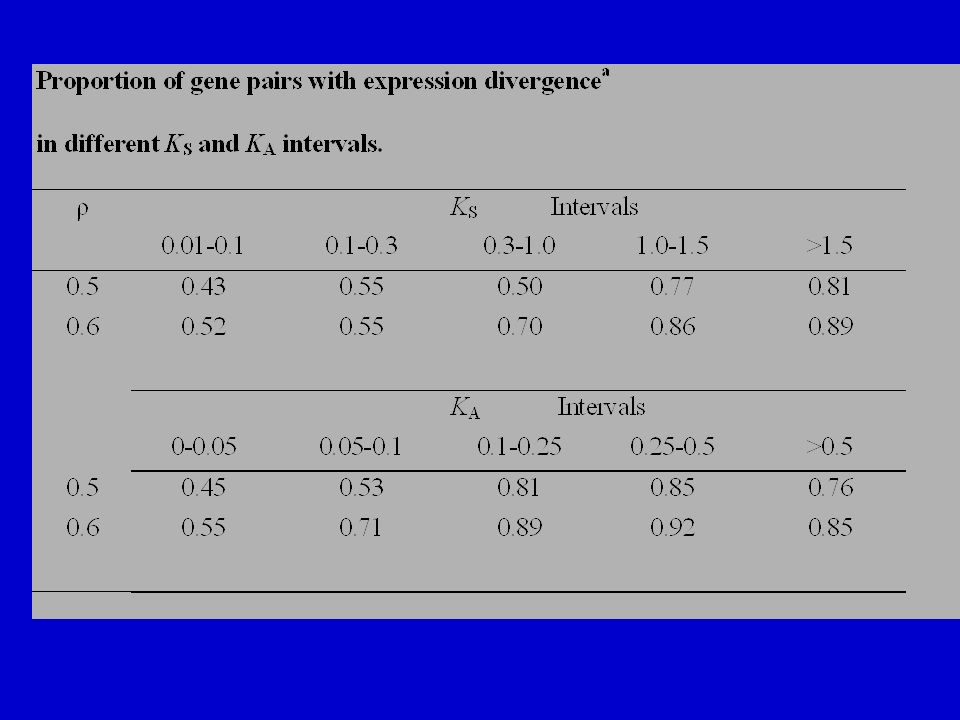
≥ 1 negative R ≥ 2 negative R Figure 2 a b

32
Figure 2a: Over 60% of the pairs studied show “divergent expression” even when K S is ≤ 0.10. The proportion of divergent expression increases with K S and becomes almost 1 when K S increases to ~1. Even if we define “divergent expression” as having ≥ 2 R’s in the 14 tests, still over 50% of the duplicate pairs meet this definition when K S is ≤ 0.10.

33
Clearly, expression divergence has occurred rather quickly in many of the gene pairs studied. This is also seen in Fig. 2b, where the proportion of pairs with diverged expression increases rapidly with K A and reaches a plateau when K A is ~0.15.

34
“Expression divergence” Two duplicate genes have diverged in expression, if the correlation coefficient (ρ) of their expression levels over time points is 0.5 or smaller.
 of their expression levels over time points is 0.5 or smaller.")
35
Data: cDNA microarray expression data 208 points

36
Test procedure: We consider 9 processes. For each process we compute the correlation coefficient (R) of the expression levels over time points. Consider the two smallest R’s. We require that the probability of observing the two smallest R’s among the 9 processes is < 0.05.
 of the expression levels over time points. Consider the two smallest R’s. We require that the probability of observing the two smallest R’s among the 9 processes is <")
37
For each of the 9 processes with 8 or more data points available, the correlation coefficient of gene expression between duplicate genes was calculated.

38
Non-parametric bootstrapping: Good for a single process (experiment) But difficult for more than one process. Parametric bootstrapping:

39
For each process, bootstrap a sample with n pseudo-data points Z * = {z * i : i=1, …, n} from a bivariate normal distribution with means and covariance matrix: Compute R *, the correlation coefficient from the bootstrap sample Z *

40
Repeating the pseudosampling procedure B times, we observe R * 1, …, R * B. The empirical distribution of R * 1, …, R * B is used to approximate the distribution of R. In particular, I{ }: an indicator function whose value is 1 when the event is true and 0 otherwise.

41
Suppose that m processes are studied and there are n j pairs of observations for process j, j = 1, …, m. From the above approximation, we can evaluate the probability of

42
Then, we can find out the probability that the two smallest R’s are smaller than c 1 and c 2, respectively, with c 2 < c 1

45
Conclusions: 1. Expression divergence between duplicate genes is significantly correlated with their synonymous divergence (K S ); 2. Expression divergence and K A are initially coupled;
; 2. Expression divergence and K A are initially coupled;.")
46
3. A large proportion of duplicate genes have diverged quickly in expression and the vast majority of gene pairs eventually become divergent in expression.

47
Divergence in the Spatial Pattern of Gene Expression between Human Duplicate Genes Genome Research, 2003 Kateryna Makova and Wen-Hsiung Li

48
Expression Data The expression data for 25 human tissues were retrieved from Su et al. (2002, PNAS). Expression values were averaged among replicates.
. Expression values were averaged among replicates..")
49
Advantages of human data over yeast data 1. Affymetrix oligonucleotide array data instead of cDNA array data: a lower chance of cross-hybridization 2. Multiple tissues: spatial expression divergence vs. temporal divergence 3. Better definition of divergence 4. A larger data set (1230 pairs of duplicate genes vs. 400 pairs)
.")
50
Definition of Expression of a gene in a tissue Expressed in a tissue: If the average difference (AD) is > 200; this corresponds to ~3 to 5 copies of mRNA per cell. Not expressed: If AD < 100. Marginally expressed: If 100 < AD < 200.

51
Definition of Expression Divergence in a tissue Two duplicate genes are said to have diverged in gene expression in a tissue, if one is expressed in the tissue while the other is not.

52
Definition is Conservative It neglects the case where both genes are expressed in the same tissue but at different levels and the case where one is expressed (or not expressed) while the other is marginally expressed.
 while the other is marginally expressed.")
53
Definition of Expression Divergence Two duplicate genes are said to have diverged in gene expression: If they show diverged expression (1) in at least one tissue (2) in at least two tissues
 in at least one tissue (2) in at least two tissues")
54
Proportion of gene pairs with diverged expression vs. Synonymous divergence

55
Rapid divergence 73% of the gene pairs with an average Ks of only 0.06 already have diverged in one of the 25 tissues studied, and 57% of these genes have diverged in expression in at least two tissues. These percentages increase to 90% and 73%, respectively, when Ks is 1.2.

56
Proportion of gene pairs with diverged expression vs. Nonsynonymous divergence

57
Rapid divergence For Ka = 0.04, 78% of the gene pairs have diverged in expression in at least one tissue and 60% have diverged in at least two tissues. For Ka = 0.21, 98% of the gene pairs have diverged in expression in at least one tissue and 88% have diverged in at least two tissues.

58
K S and the correlation coefficient of gene expression (both genes are expressed in at least five tissues)
")
59
K A and the correlation coefficient of gene expression (both genes are expressed in at least five tissues)
")
60
Conclusions Human duplicate genes diverge rapidly in expression among tissues. The results support the conclusion in yeast. In fact, in terms of generation time human duplicate genes seem to diverge in expression faster than yeast duplicate genes.

61
Gene Pairs with Rapid Divergence Ks < 0.3 Diverged in expression in at least 50% of the tissues studied. Or R < 0.5. The genes in the two groups largely overlap.

62
Enzymes: Oxidoreductases, hydrolases, transferases, and an isomerase Immune system: Lymphocyte antigens, cytokine gro-beta, MHC proteins, and immunoglobulins. Transcription factors Structural proteins: Amelogenin, karetin, skeletal muscle protein, etc. Functions of Gene Pairs with Rapid Divergence

63
A significantly higher proportion of immune response genes among gene pairs with rapid expression divergence in comparison with other gene pairs in our study: P < 0.009 for gene pairs with K S < 0.5 and diverged expression in at least 50% of studied tissues; P < 0.001 for gene pairs with K S < 0.5 and R < 0.5. Functions of Gene Pairs with Rapid Divergence

64
Role of Duplicate Genes in Genetic Robustness against Loss-of-Function Mutations Nature, January 2003 Z. Gu and Wen-Hsiung Li Ecology & Evolution University of Chicago Lars Steinmates and Ron Davis Stanford University

65
How does an organism compensate for null mutations? 1. Duplicate genes: Deletion of a gene is compensated by another member of the same gene family. 2. Stability of genetic networks: Alternative metabolic pathways or regulatory gene networks (unrelated genes) Which is more important?
 Which is more important .")
66
Data we used: Gene deletion and parallel analysis of ~ 6,000 genes in the yeast genome: 1. Delete one gene 2. Measure the relative growth rate (f i ) of the mutant to a reference population (the growth rate of the pooled mutants) in 5 different media conditions.
 of the mutant to a reference population (the growth rate of the pooled mutants) in 5 different media conditions..")
67
Data: Singletons: 1,275 genes Does not hit any other genes in FASTA search with E value 0.1. Selected genes that had been studied Duplicates: 1,147 genes As defined in Gu et al. (2002) Real genes; avoid pseudogene
 Real genes; avoid pseudogene.")
68
Classification of fitness effects Weak or no effect: f min > 0.95 Moderate effect: 0.8 < f min < 0.95 Strong effect: 0 < f min < 0.8 Lethal: f min = 0

69
Discrete distributions of fitness effect for duplicate genes and singletons

70
YPD Cumulative distributions of fitness effect for duplicate gene and singleton under the YPD growth condition

71
Conclusion 1: Singleton and duplicate genes differ significantly in the distribution of growth rate effects of gene deletion

72
Hypothesis: Duplicate genes have more similar fitness effects than singletons

73
D ij : difference in fitness effect between genes i and j. Compare the mean D ij for duplicate genes and the dist. of D ij for randomly selected 100,000 sets of singleton pairs D* = 0.193 YPD, P < 10 -5

74
Hypothesis: Genes with closer homologs should be compensated more often 1.Divide duplicate genes into different groups using the K A value of each duplicate gene to its most similar homolog in the genome. 2. Calculate the distribution of fitness effect in each K A interval.

75
Relationship between protein distance and fitness effect of deletion

76
Does the deletion of a duplicate with a higher expression level have a more severe fitness effect than the deletion of the other copy?

77
For duplicate gene pairs with different fitness effect (|2(F1-F2)|/(F1+F2) >0.05), the gene with higher level of expression has a stronger fitness of gene deletion: Not similar One lethal Similar Higher expression7250125 Lower expression2612108 Significance?Yes No
|/(F1+F2) >0.05), the gene with higher level of expression has a stronger fitness of gene deletion: Not similar One lethal Similar Higher expression Lower expression Significance Yes No")
78
Relative contribution of duplicate genes to genetic robustness: Lower bound (23% ): The extra proportion of duplicate genes with weak or no effects compared to that for singletons is due to genetic redundancy. 284 genes are compensated due to gene duplication: 1,147 duplicates (64.3% for duplicates – 39.5% for singletons) Altogether 1,241 genes are compensated: 1,147 duplicates 64.3% + 1,275 singletons 39.5%
 Altogether 1,241 genes are compensated: 1,147 duplicates 64.3% + 1,275 singletons 39.5%.")
79
Discrete distributions of fitness effect for duplicate genes and singletons

80
Upper bound (59% ): All the duplicate genes in the class of weak or no effect are due to genetic redundancy. 738 duplicate genes (1,147 duplicates 64.3%) and 503 singleton genes (1,275 singletons 39.5%) show weak or no effect after deletion 738/(738 + 503) = 59%
 and 503 singleton genes (1,275 singletons 39.5%) show weak or no effect after deletion 738/( ) = 59%.")
81
Conclusions: 1.Duplicate genes contribute at least 25% to the genetic robustness against null mutations in the yeast genome 2. Duplicate genes have more similar fitness effects of gene deletion than singletons

82
Conclusions: 3. Duplicate genes with closer homologs have a higher probability to be compensated 4. The duplicate copy with a higher expression level has a stronger fitness effect of deletion

83
Thanks!

Similar presentations


 for Clustering Gene Expression Data K. Y. Yeung and W. L. Ruzzo.>")


 The Mechanics of Alignments.>")

