Download presentation
Presentation is loading. Please wait.

1
Statistics Education, Early 21st Century, New Zealand Pip Arnold Team Solutions The University of Auckland Presentation to Primary Symposium 2009

3
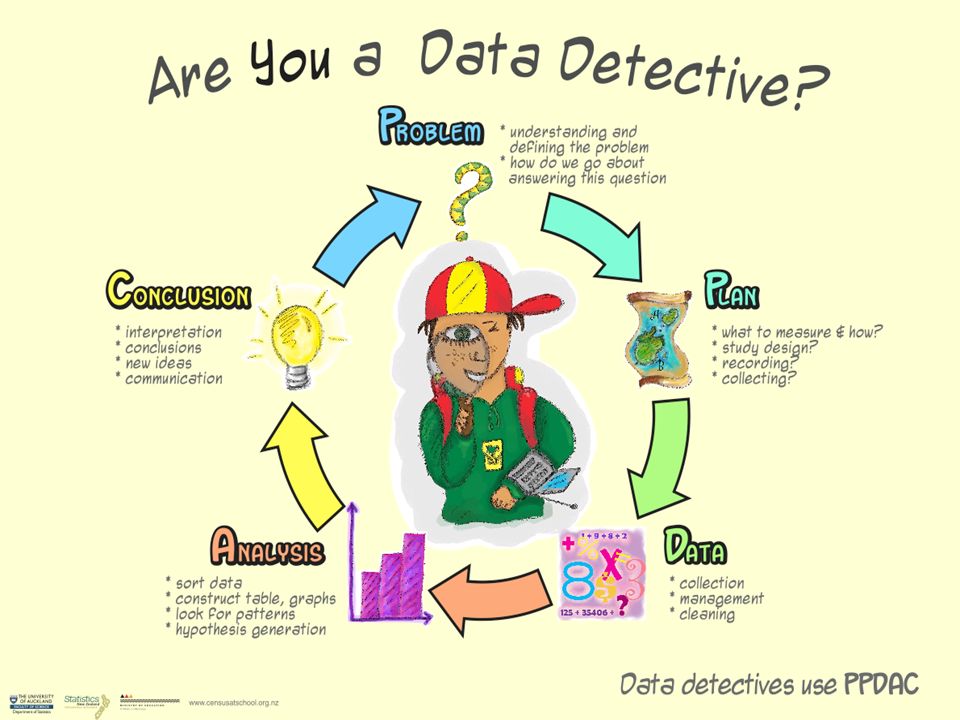
Problem Statistical investigation cycle Has at its heart a starting point based on a problem. Four or five phases. –Wild & Pfannkuch, 1999 –Graham, 2006 –Franklin & Garfield, 2006

5
Problem My theory is that there is question posing and question asking. Question posing results in a question being formally structured, Whereas question asking is a continual spontaneous interrogative process.

6
Posing questions Question posing arises as a result of having a problem that needs to be addressed using a statistical investigation. Investigative question –The question being asked of the data Survey question –The question asked to get the data

7
Asking questions The interrogative questions – questions that are asked as checks within the cycle (the problem, the plan, the data (given data sets), the analysis, the conclusion); The analysis questions that are asked about the statistics, graphs and tables to develop a description of the data.
, the analysis, the conclusion); The analysis questions that are asked about the statistics, graphs and tables to develop a description of the data.")
8
Types of Investigative Questions Summary –A description of the data, usually a single data set –Focus at curriculum levels 1-4 Comparison –Comparing two (or more) sets of data across a common variable –Introduced at curriculum level 3, major focus from curriculum level 5 Relationship –Interrelationship between two paired variables –Introduced at curriculum level 4
 sets of data across a common variable –Introduced at curriculum level 3, major focus from curriculum level 5 Relationship –Interrelationship between two paired variables –Introduced at curriculum level 4")
9
Getting to know our class Our motivating situation is to find out some information about our class, but as a whole class, not just as individuals. We want to be able to describe our class. Brainstorm some ideas of what we could find out about our class.

10
Ideas? In pairs or groups discuss what things might be appropriate for Yr 1-2, Yr 3-4, Yr 5-6, Yr 7-8. eg: month of birth, where they were born, number of brothers and sisters, height…

11
Investigative questions From the ideas suggested generate investigative questions about the class. As a class you might have a number of investigative questions you want to answer. –What are typical months for birthdays in our class? –What are typical numbers of brothers and sisters for students in our class?

12
Plan Planning where the data is collected. –Happens once the problem is set. –What variables do we need to collect? –How are we going to collect them? –How will we measure them?

13
Survey questions One aspect of planning is posing survey questions. These need to be specific in order to collect the relevant data.

14
CensusAtSchool This survey is open to students from Year 5 -13. Some ideas here about survey questions, which may be useful for all levels. Making measures document.

15
CensusAtSchool Two student generated questions 2008. Are you born in NZ? How many brothers and sisters do you have?

16
Are you born in NZ? Born is something that happened in the past, so use “were” rather than “are”. Gives a yes/no answer which might be less interesting to work with. So could try Where were you born? Problems with this… City, hospital, country… what are you asking here?

17
How many brothers and sisters do you have? Do we include step-, half- ? Sensitivity around siblings that may have died… This question did not make it into the survey.

18
Our survey questions What year level do you teach? In what month of the year is your birthday? What is your favourite TV show? How long does it usually take you to get to work? (answer to the nearest minute) What country were you born in?
 What country were you born in .")
19
Collecting data Logistics Use post it notes: –Colour for year level teaching Blue Yr 1-2; Purple Yr 3-4; Yellow Yr 5-6; Pink Yr 7-8 –Split into four parts for other variables Write on the non-sticky side!

20
Collecting data In what month is your birthday? What is your favourite TV show? How long does it usually take you to get to work? (answer to the nearest minute) What country were you born in?
 What country were you born in .")
21
Investigative questions As a group pose an investigative question that you can answer using the data on your data cards. Remember to make your question about the whole group. Eg: Typically, what are favourite icecream flavours of people in this group?

22
Analysis Make a graph using your data cards that will help you to answer your question. Describe the graph identifying patterns and trends in context. (NZC)
.")
23
Analysis Use I notice… as a starter for descriptive statements. For category variables: birth month; favourite TV show; country born in –Shape –The most common category, the least common category, other catergories of interest –Anything unusual, or of interest For measurement variables: time taken to get to work –Shape –Spread –Middle group(s) –Anything unusual, or of interest Remember context. If I cover any labels can I still tell what the graphs are showing.
 –Anything unusual, or of interest Remember context. If I cover any labels can I still tell what the graphs are showing..")
24
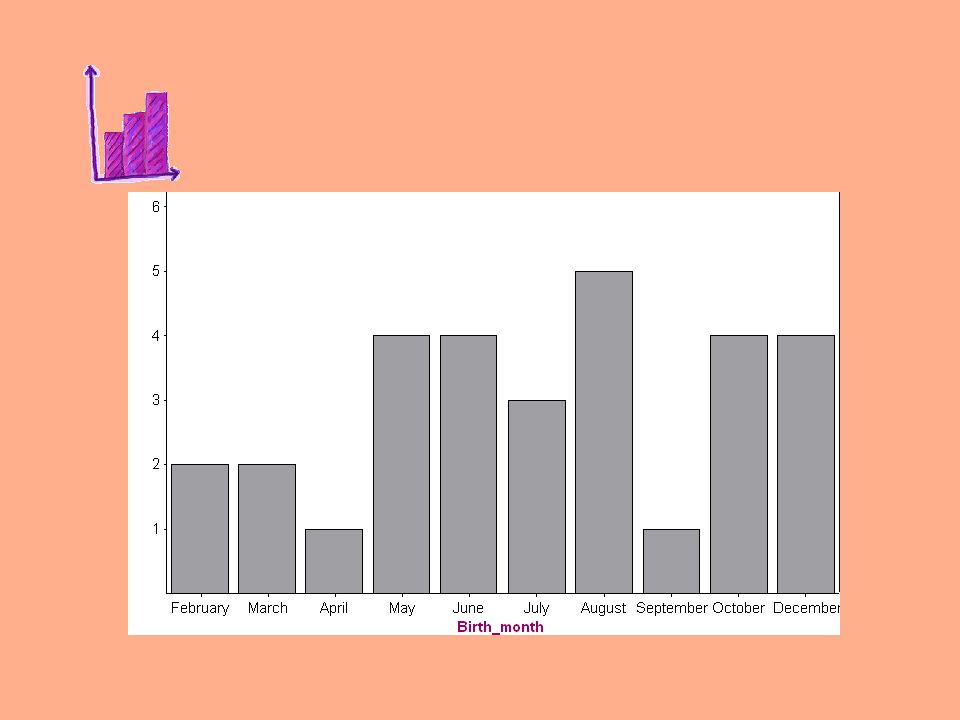
Investigative question What are typical birth months for people in this group?

26
I notice that the most common birth month is August with 5 people in the group. I notice the least common birth months are January and November with no one in the group born in these months. I notice that four months have four people born in them, they are May, June, October and December. I notice that the Winter months have the most people born in them, 12 people. Spring has the least number of people born with only 5 people born then, Summer has 6 people born then and Autumn has 7 people born then.

27
Analysis Need to model. Need to give structure. Need to remember context. Need to do in class. Need to describe not just answer question.

28
Conclusion Some starting points for conclusions. –Answer the question. –Provide supporting evidence from your analysis.

29
Conclusion What are typical birth months for people in this group? –Birth months for this group are generally in the winter. –August has highest number of people born in it, 5 people. June has 4 people and July has 3 people. Altogether from the group of 30 people, 12 were born in winter. May, October and December have 4 people born in them. The other seasons, spring, summer and autumn have 5, 6 and 7 people born respectively.

30
Websites for data CensusAtSchool NZ –http://www.censusatschool.org.nz/http://www.censusatschool.org.nz/ CensusAtSchool International –http://www.censusatschool.ntu.ac.uk/http://www.censusatschool.ntu.ac.uk/ Statistics NZ –http://www.stats.govt.nz/schools-corner/default.htmhttp://www.stats.govt.nz/schools-corner/default.htm Exploring data –http://exploringdata.cqu.edu.au/datasets.htmhttp://exploringdata.cqu.edu.au/datasets.htm

31
CensusAtSchool 2003 –18,000 participants; 682 schools –26 variables; Year 5-10 2005 –33,205 participants; 18,516 girls; 14,689 boys –32 variables; Year 5-10 2007 –25,007 participants; 13,578 girls; 11,429 boys –31 variables; Years 5-13

32
CensusAtSchool All year Register online http://www.censusatschool.org.nz/2009/register/

33
CensusAtSchool NEW FOR 2009 Teachers will get their class results back if they choose. 2009 data can be used for 2009 teaching.

Similar presentations