Download presentation
Presentation is loading. Please wait.

1
A writing rubric for “describe” or “explain” questions in Maths and Stats. Presented by Jeremy Brocklehurst

2
Co-educational secondary school: Y9 13. 15 minutes out of Christchurch. Roll: About 1600. School-wide focus on developing thinking (SOLO Taxonomy) since 2007. (Pam Hook: http://hooked-on-thinking.com ) Then in 2012, school wide focus on developing templates for writing.
 since (Pam Hook: ) Then in 2012, school wide focus on developing templates for writing..")
3
Success criteria for this workshop!

4
Examples of describe/explain questions Compare the performance of these 2 players over the seasons shown in the graph.

5
2013 Level 2 Probability external Compare and contrast the two distributions. You should discuss shape, centre and spread in relation to the context.

6
2014 Level 2 Probability external Discuss the distributions. In your answer you should include some relevant calculations and some comparisons. You should also discuss shape, centre and spread.

7
2014 Level 2 Probability external Discuss the distributions. In your answer you should include some relevant calculations and some comparisons. You should also discuss shape, centre and spread.

8
2013 L3 Probability Distributions

9
2014 L3 Probability Distributions Number of Latte’s out of 5 made with trim milk

10
Heights of male and female students from the South African Census @ School Database Describe features of the distributions comparatively.

11
And it’s not just a Stats thing…

12
In Scholarship Calculus:

14
Have a go at one: The following graphs are distributions of ages in two populations. The United States of America (based on US census data) and Facebook users: Describe features of the distributions comparatively. Aim to make at least three statements. Support your statements with statistical evidence.
 and Facebook users: Describe features of the distributions comparatively. Aim to make at least three statements. Support your statements with statistical evidence..")
15
Have a go at one: The following graphs are distributions of ages in two populations. The United States of America (based on US census data) and Facebook users: Describe features of the distributions comparatively. Aim to make at least three statements. Support your statements with statistical evidence.
 and Facebook users: Describe features of the distributions comparatively. Aim to make at least three statements. Support your statements with statistical evidence..")
16
Context…

17
When given an “explain”, “describe” or “compare and contrast” task: What are common difficulties that students have?

18
What people said in workshops…

19
When given an “explain”, “describe” or “compare and contrast” task: What are common difficulties that students have? -Getting started. -Handling lack of information or information they don’t understand. -Confidence – fear of being wrong so I won’t try. -Not sure what statistical terms to use. -Stating what’s obvious and spelling it out. -How to back up my points using evidence from these graphs? -Comparitive language. If asked to compare the features of 2 distributions of data, students tend to describe them separately rather than comparing them. -Talk about the graphs but no contextual links. -Write only about context – no links to statistical evidence (social studies answer). -Having the right language/vocab – what does “compare” actually mean I have to do? Likewise “discuss” vs “explain”.
. -Having the right language/vocab – what does compare actually mean I have to do. Likewise discuss vs explain ..")
20
Writing rubrics can be useful

21
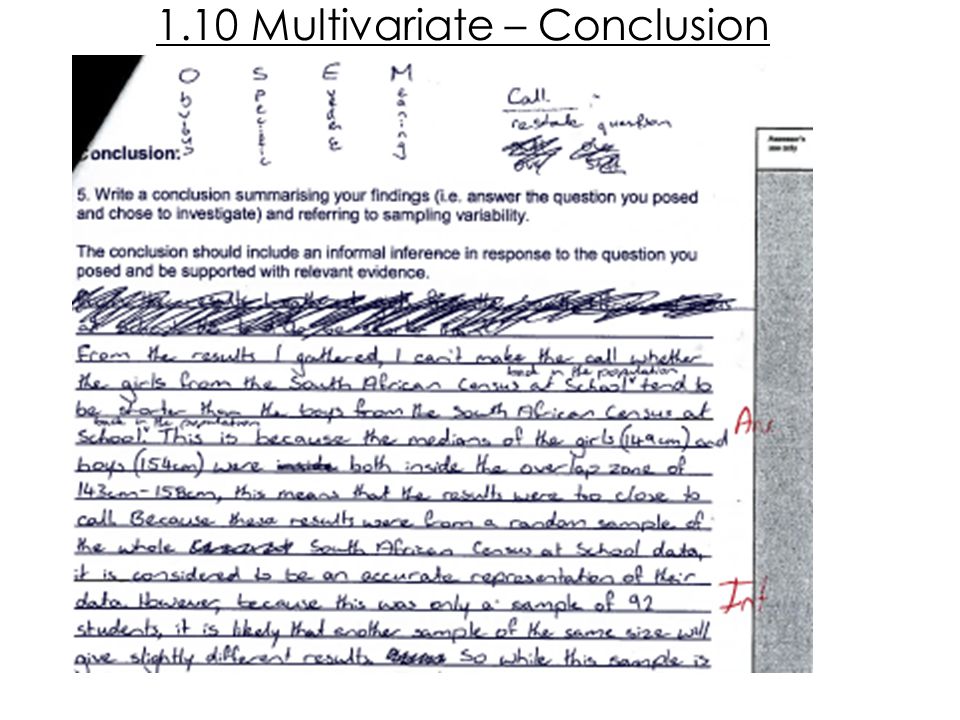
What the OSEM writing frame means: O stands for Obvious observations Write down one thing you notice, then leave a gap, and write down something else you notice. Try to get 3 obvious things. S is for Specific Under each obvious observation, explain what you mean so that another person would get it. E is for Evidence Support each observation with numbers or calculations. M is for Meaning: Make sense of it. So what? Write Write down what each of your points tells you about the original problem/situation. What else could we find out?

22
What the OSEM writing frame means: O stands for Obvious observations: Write down one thing you notice, then leave a gap, and write down something else you notice. Try to get 3 obvious things. S is for Specific: Under each obvious observation, explain what you mean so that another person would get it. E is for Evidence: Support each observation with numbers or calculations. M is for Meaning: Make sense of it. So what? Write Write down what each of your points tells you about the original problem/situation. What else could we find out?

23
What the OSEM writing frame means: O stands for Obvious observations: Write down one thing you notice, then leave a gap, and write down something else you notice. Try to get 3 obvious things. S is for Specific: Under each obvious observation, explain what you mean so that another person would get it. E is for Evidence: Support each observation with numbers or calculations. M is for Meaning: Make sense of it. So what? Write down what each of your points tells you about the original problem/situation. What else could we find out?

24
What the OSEM writing frame means: O stands for Obvious observations: Write down one thing you notice, then leave a gap, and write down something else you notice. Try to get 3 obvious things. S is for Specific: Under each obvious observation, explain what you mean so that another person would get it. E is for Evidence: Support each observation with numbers or calculations. M is for Meaning: Make sense of it. So what? Write down what each of your points tells you about the original problem/situation. What else could we find out?

25
What the OSEM writing frame means: O stands for Obvious observations: Write down one thing you notice, then leave a gap, and write down something else you notice. Try to get 3 obvious things. S is for Specific: Under each obvious observation, explain what you mean so that another person would get it. E is for Evidence: Support each observation with numbers or calculations. M is for Meaning: Make sense of it. So what?

26
What the OSEM writing frame means: O stands for Obvious observations: Write down one thing you notice, then leave a gap, and write down something else you notice. Try to get 3 obvious things. S is for Specific: Under each obvious observation, explain what you mean so that another person would get it. E is for Evidence: Support each observation with numbers or calculations. M is for Meaning: Make sense of it. So what? Write down what each of your points tells you about the problem/situation.

27
What the OSEM writing frame means: O stands for Obvious observations: Write down one thing you notice, then leave a gap, and write down something else you notice. Try to get 3 obvious things. S is for Specific: Under each obvious observation, explain what you mean so that another person would get it. E is for Evidence: Support each observation with numbers or calculations. M is for Meaning: Make sense of it. So what? Write down what each of your points tells you about the problem/situation. This is all about the context.

28
M is for Meaning: Make sense of it. So what? The “Meaning” bit has 2 aspects:

29
M is for Meaning: Make sense of it. So what? Explanations Implications The “Meaning” bit has 2 aspects:

30
M is for Meaning: Make sense of it. So what? Explanations The “Meaning” bit has 2 aspects:

31
M is for Meaning: Make sense of it. So what? 1. Make sense of it. The “Meaning” bit has 2 aspects: Explanations

32
M is for Meaning: Make sense of it. So what? 1. Make sense of it. Explanations. The “Meaning” bit has 2 aspects: Explanations

33
M is for Meaning: Make sense of it. So what? 1. Make sense of it. Explanations. “This makes sense because...” Explanations The “Meaning” bit has 2 aspects:

34
M is for Meaning: Make sense of it. So what? 1. Make sense of it. Explanations. “This makes sense because...” “This could be because…” Explanations The “Meaning” bit has 2 aspects:

35
M is for Meaning: Make sense of it. So what? 1. Make sense of it. Explanations. “This makes sense because...” “This could be because…” “This is surprising because…” Explanations The “Meaning” bit has 2 aspects:

36
M is for Meaning: Make sense of it. So what? 1. Make sense of it. Explanations. “This makes sense because...” “This could be because…” “This is surprising because…” “Another factor that could be involved here is…” Explanations The “Meaning” bit has 2 aspects:

37
M is for Meaning: Make sense of it. So what? 1. Make sense of it. Explanations. “This makes sense because...” “This could be because…” “This is surprising because…” “Another factor that could be involved here is…” 2. So what? Implications The “Meaning” bit has 2 aspects:

38
M is for Meaning: Make sense of it. So what? 1. Make sense of it. Explanations. “This makes sense because...” “This could be because…” “This is surprising because…” “Another factor that could be involved here is…” 2. So what? Implications. The “Meaning” bit has 2 aspects: Implications

39
M is for Meaning: Make sense of it. So what? 1. Make sense of it. Explanations. “This makes sense because...” “This could be because…” “This is surprising because…” “Another factor that could be involved here is…” 2. So what? Implications. How is this relevant to your original question? Research – what have other studies found out about this? How can we show “Statistical Insight” here? The “Meaning” bit has 2 aspects: Implications

40
M is for Meaning: Make sense of it. So what? 1. Make sense of it. Explanations. “This makes sense because...” “This could be because…” “This is surprising because…” “Another factor that could be involved here is…” 2. So what? Implications. How is this relevant to your original question? Research – what have other studies found out about this? Statistical Insight : Link Stats + Context and look deeper. The “Meaning” bit has 2 aspects: Implications

41
M is for Meaning: Make sense of it. So what? 1. Make sense of it. Explanations. “This makes sense because...” “This could be because…” “This is surprising because…” “Another factor that could be involved here is…” 2. So what? Implications. How is this relevant to your original question? Research – what have other studies found out about this? Statistical Insight : Link Stats + Context and look deeper. The “Meaning” bit has 2 aspects: Implications Explanations

42
What the OSEM writing frame means: O stands for Obvious observations: Write down one thing you notice, then leave a gap, and write down something else you notice. Try to get 3 obvious things. S is for Specific: Under each obvious observation, explain what you mean so that another person would get it. E is for Evidence: Support each observation with numbers or calculations. M is for Meaning: Make sense of it. So what? Write down what each of your points tells you about the problem/situation. This is all about the context.

43
Examples of student work…

44
% Observe (look for obvious)
")
45
% Specific with Evidence (numbers)
")
46
% Meaning:

47
% Meaning: So what?

48
% Meaning: So what? What does this tell us about the situation?

49
Year 9…

50
Meaning -Make sense of it. -So what? Year 10 chance investigation: Win at the Fair Obvious observations Specific Evidence (numbers, calculations)
.")
51
Year 10 chance investigation: Win at the Fair

52
In the Level 1 Multivariate Data standard (1.10), my students found OSEM a useful guide when writing their conclusions:
, my students found OSEM a useful guide when writing their conclusions:")
53
1.10 Multivariate – Conclusion

55
And even in Level 2 Coordinate Geometry

56
Specific (labelling) E vidence (calculations) Meaning (so what?) (Relate back to problem ) Obvious observations
 E vidence (calculations) Meaning (so what ) (Relate back to problem ) Obvious observations")
57
Reference for SOLO Taxonomy symbols: Pam Hook: http://hooked-on-thinking.comhttp://hooked-on-thinking.com

59
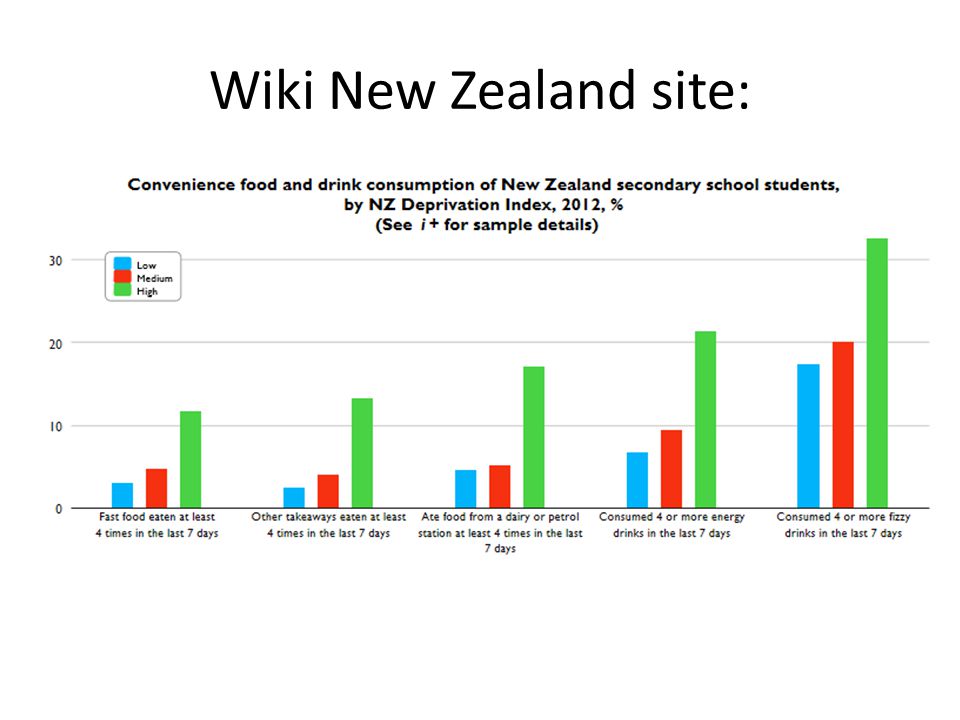
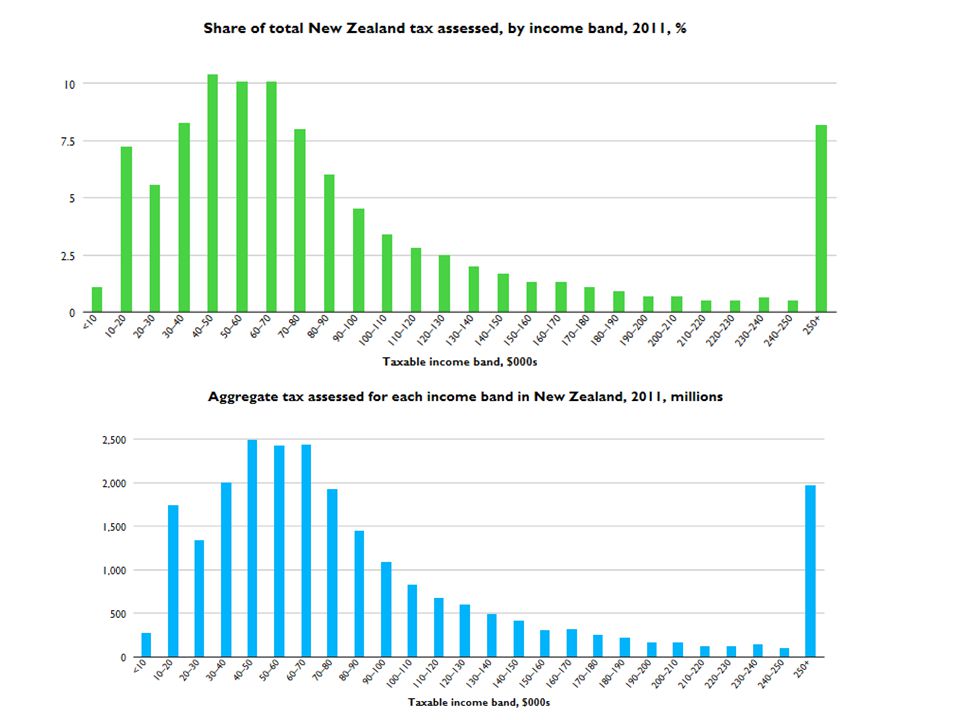
Great resources to practice describing displays using NZ data Wiki New Zealand website: http://wikinewzealand.org/?cat=280

60
Wiki New Zealand site:

65
(a) Leaflets from us – pay a fixed amount per leaflet (b) Leaflets delivery co. pays them per bundle of 50 leaflets. If a student delivers more than 300 leaflets they are paid more per bundle. School students are paid to deliver weekly advertising leaflets to houses.

66
In groups: 1.Each person has a sheet. 2.Each person fills in one Obvious observation. 3.Then fill in the “Specific” part for your observation 3.Continue in this way, passing each sheet around until OSEM are completed for all 4 boxes. 4. Then have a go at the Extended Abstract part.

68
Unistructural Obvious observations: I can identify one relevant feature. Multistructural Specific with Evidence: My description includes specific details (e.g. locations on the scale) AND is supported by evidence (numbers and units). Relational Meaning: I can relate my specific observations back to the context the graph represents. (link – sequence, classify, compare and contrast, explain causes, explain consequences, analyse (part whole)). Extended Abstract Go somewhere with it… I can make decisions based on the evidence I can predict the effects of changes to the features. I can adapt my observations to other situations (generalise) (new way – generalise, evaluate, predict, and create). Success Criteria: OSEM
 AND is supported by evidence (numbers and units). Relational Meaning: I can relate my specific observations back to the context the graph represents. (link – sequence, classify, compare and contrast, explain causes, explain consequences, analyse (part whole)). Extended Abstract Go somewhere with it… I can make decisions based on the evidence I can predict the effects of changes to the features. I can adapt my observations to other situations (generalise) (new way – generalise, evaluate, predict, and create). Success Criteria: OSEM.")
69
Examples of describe/explain questions (a) Leaflets from us – pay a fixed amount per leaflet (b) Leaflets delivery co. pays them per bundle of 50 leaflets. If a student delivers more than 300 leaflets they are paid more per bundle. School students are paid to deliver weekly advertising leaflets to houses. Explain how and why the graph in part (b) is different to the graph in part (a).
 is different to the graph in part (a)..")
70
(b) Leaflets delivery co. pays them per bundle of 50 leaflets.
 Leaflets delivery co. pays them per bundle of 50 leaflets.")
Similar presentations