Download presentation
Presentation is loading. Please wait.

1
H.-J. Bernhardt 2002 The CIE Standard Observer Early in the last century it became evident, that a way must be found to quantify the color sensation. Basic knowledge and ideas on color vision are very old: 1666 Newton was able to „decompose“ white light and recompose it 1777 Palmer suggested a trichromatic hypothesis of color vision 1802 Young showed that it is possible to compose all colors by three different light sources: red, green and blue Helmholtz (1821-1894) worked on physiological optics Maxwell (1831-1879) made many color experiments A commission was founded called „Commission international d‘éclairage“ (CIE). In 1931 the CIE published the first report: clear definitions, procedures and constants valid for the so called „standard observer“. Early in the last century it became evident, that a way must be found to quantify the color sensation. Basic knowledge and ideas on color vision are very old: 1666 Newton was able to „decompose“ white light and recompose it 1777 Palmer suggested a trichromatic hypothesis of color vision 1802 Young showed that it is possible to compose all colors by three different light sources: red, green and blue Helmholtz (1821-1894) worked on physiological optics Maxwell (1831-1879) made many color experiments A commission was founded called „Commission international d‘éclairage“ (CIE). In 1931 the CIE published the first report: clear definitions, procedures and constants valid for the so called „standard observer“.
 worked on physiological optics Maxwell ( ) made many color experiments A commission was founded called „Commission international d‘éclairage (CIE). In 1931 the CIE published the first report: clear definitions, procedures and constants valid for the so called „standard observer . Early in the last century it became evident, that a way must be found to quantify the color sensation. Basic knowledge and ideas on color vision are very old: 1666 Newton was able to „decompose white light and recompose it 1777 Palmer suggested a trichromatic hypothesis of color vision 1802 Young showed that it is possible to compose all colors by three different light sources: red, green and blue Helmholtz ( ) worked on physiological optics Maxwell ( ) made many color experiments A commission was founded called „Commission international d‘éclairage (CIE). In 1931 the CIE published the first report: clear definitions, procedures and constants valid for the so called „standard observer ..")
2
H.-J. Bernhardt 2002

3
Calculation of Color Values Color Definition Definition of color Color is the sensation of the eye with which it possible to distinct two adjacent parts of a structurefree observation field (DIN 5033, CIE) White and black are colors in the sense of the definition. Color is not a property of matter. The same color can be evoked by various stimulation curves (so called Metamerism). Identical stimulation curves always result in identical colors.
. Identical stimulation curves always result in identical colors..")
4
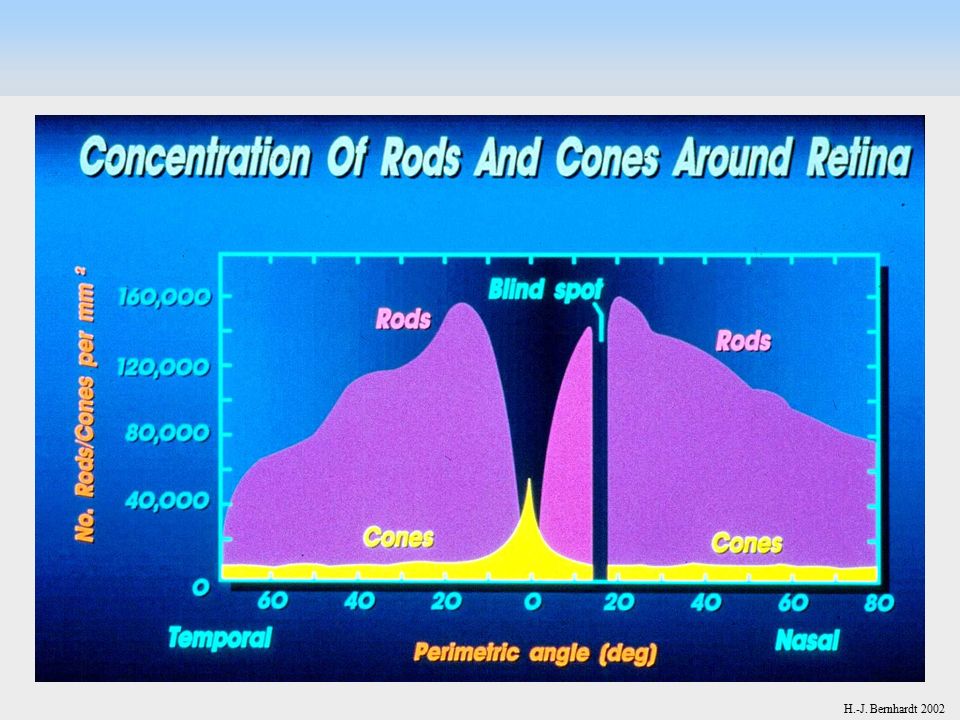
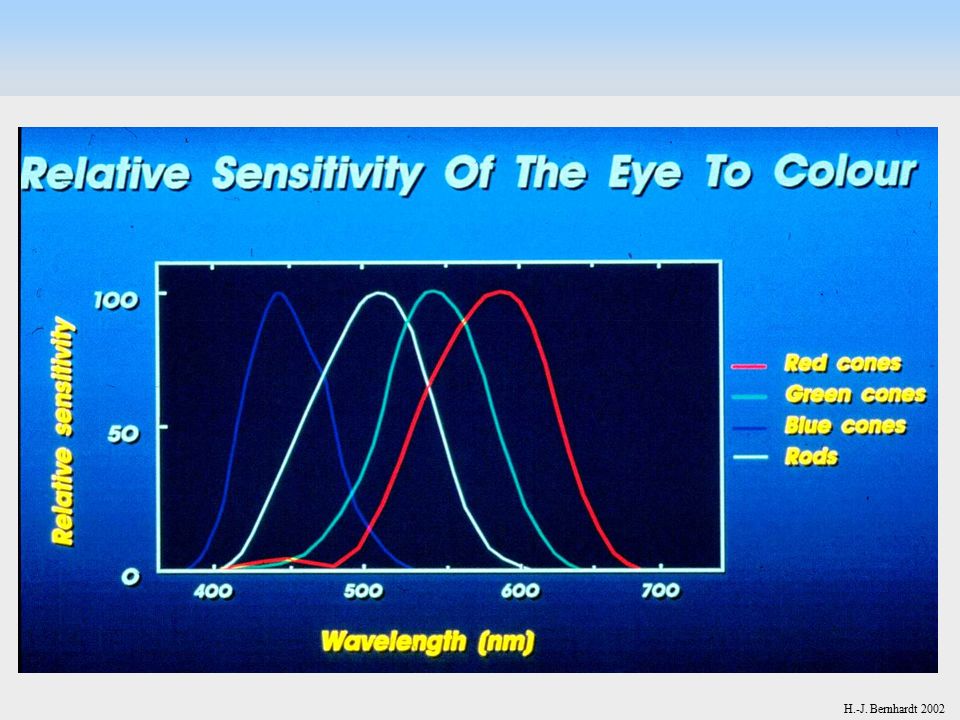
H.-J. Bernhardt 2002 The Human Eye 3 types of cones for color vision in retina Rodes for luminance

5
H.-J. Bernhardt 2002 The Human Retina

6
H.-J. Bernhardt 2002

9
Color Formation Radiation function S

10
H.-J. Bernhardt 2011 Subtraktive und additive Farbmischung Additive Farbmischung Subtraktive Farbmischung Absorption durch einen oder mehrere Filter Projektion von farbigem Licht auf eine weiße Fläche

11
H.-J. Bernhardt 2002

12
C = RR+GG+BB Does not work in the blue-green region 435 nm 546 nm 700 nm Therefore: C+RR=GG+BB C=-RR+GG+BB

13
H.-J. Bernhardt 2002 Tristimulus Values for Real Primary Sources Using the three primary sources of 700nm, 546nm and 435 nm the tristimulus values show negative values for color matching in the green region.

14
H.-J. Bernhardt 2002

15
Color Point C in a Three Dimensional Rectangular Diagram (Rotated) R G B C C = RR+GG+BB R,G,B: unit vectors C hits the unit plane of R,G,B in point C
 R G B C C = RR+GG+BB R,G,B: unit vectors C hits the unit plane of R,G,B in point C")
16
H.-J. Bernhardt 2002 The Unit Plane in Tristimulus Color Space C The vector of color C intersects the unit plane in point C. The coordinates are r, g, b r = g = b = R R + G + B G R + G + B B R + G + B r+g+b=1 therefore only two values are needed

17
H.-J. Bernhardt 2002 Chromaticity Diagram for Real Primaries 700 nm, 546 nm, 435 nm

18
H.-J. Bernhardt 2002 Transition From the Real Primary RGB Illumination to Imaginary X,Y,Z In order to avoid negative color values, the real primary illuminations R, G, B were exchanged with the virtual illuminations X,Y, Z. All needed constants were transformed mathematically. Result is the well known CIE chromaticity diagram

19
H.-J. Bernhardt 2002 CIE Tristimulus Functions The numerical values of the tristimulus functions are tabulated by the CIE Tristimulus functions x y z

20
H.-J. Bernhardt 2002 The CIE Color Chart Purple line Locus of spectral colors

21
H.-J. Bernhardt 2002 The CIE Chromaticity Diagram

22
H.-J. Bernhardt 2002 Relative Spectral Power Distribution for Illuminant A, C, SUN The numerical values of the radiation functions are tabulated by the CIE

23
H.-J. Bernhardt 2002 Illuminants A, C, D65 in the Chromaticity Diagram Black Body Radiator from 2500 to Infinite °Kelvin

24
H.-J. Bernhardt 2002 Schematic Color Calculation – Body Colors, Self Radiators Standard Illumination A, C, D65 S Body (opaque mineral) R S *R Color stimulation Self radiator (e.g. lamp) S = Eye 3 types of cones (x y z ) * Brain Subjective color vision S Radiation function of a standard source Color stimulation function R Spectral reflectance x y z Tristimulus functions k Normalisation factor to Y = 1 Z= k* R( )*S( )*z( )*d( ) X= k* R( )*S( )*x( )*d( ) Y= k* R( )*S( )*y( )*d( ) x=x= X+Y+Z X z=z= Z y=y= Y
 R S *R Color stimulation Self radiator (e.g. lamp) S = Eye 3 types of cones (x y z ) * Brain Subjective color vision S Radiation function of a standard source Color stimulation function R Spectral reflectance x y z Tristimulus functions k Normalisation factor to Y = 1 Z= k* R( )*S( )*z( )*d( ) X= k* R( )*S( )*x( )*d( ) Y= k* R( )*S( )*y( )*d( ) x=x= X+Y+Z X z=z= Z y=y= Y.")
25
H.-J. Bernhardt 2002 Determination of Helmholtz Values Color value of sample Color value of illumination C P P Draw a line from P via the point of the illuminant ( here it is C) to the locus of spectral colors. There read the dominant wavelength (D). Calculate the relation CP/CD. It is the spectral purity value given in %. If the line CP leads to the purple line, read the dominant wavelength at the spectral color locus and index the value by c (complementary) Draw a line from P via the point of the illuminant ( here it is C) to the locus of spectral colors. There read the dominant wavelength (D). Calculate the relation CP/CD. It is the spectral purity value given in %. If the line CP leads to the purple line, read the dominant wavelength at the spectral color locus and index the value by c (complementary) D D Dominant wavelength Purple line
 to the locus of spectral colors. There read the dominant wavelength (D). Calculate the relation CP/CD. It is the spectral purity value given in %. If the line CP leads to the purple line, read the dominant wavelength at the spectral color locus and index the value by c (complementary) Draw a line from P via the point of the illuminant ( here it is C) to the locus of spectral colors. There read the dominant wavelength (D). Calculate the relation CP/CD. It is the spectral purity value given in %. If the line CP leads to the purple line, read the dominant wavelength at the spectral color locus and index the value by c (complementary) D D Dominant wavelength Purple line.")
26
H.-J. Bernhardt 2002 Color Calculation for Ore Minerals Step 1: define step size of wavelengths Step 2: define illuminant Step 3: normalize tristimulus values to Y = 1 Step 4: multiply all reflectance values R with the corresponding tristimulus x,y,z and illuminant values S Step 5: build the three sums X,Y,Z Step 6: compute x,y,z, Y (is the luminance) Result: x,y,Y Step 1: define step size of wavelengths Step 2: define illuminant Step 3: normalize tristimulus values to Y = 1 Step 4: multiply all reflectance values R with the corresponding tristimulus x,y,z and illuminant values S Step 5: build the three sums X,Y,Z Step 6: compute x,y,z, Y (is the luminance) Result: x,y,Y
 Result: x,y,Y Step 1: define step size of wavelengths Step 2: define illuminant Step 3: normalize tristimulus values to Y = 1 Step 4: multiply all reflectance values R with the corresponding tristimulus x,y,z and illuminant values S Step 5: build the three sums X,Y,Z Step 6: compute x,y,z, Y (is the luminance) Result: x,y,Y.")
27
H.-J. Bernhardt 2002 Iso-Iluminance Lines Projected on the Chromaticity Diagram

28
H.-J. Bernhardt 2002 The Three Dimensional Color Body Color Point of illuminant C In the color space and on the chromaticity diagram

29
H.-J. Bernhardt 2002 The Munsell Color Diagram

Similar presentations


 Scottsdale,>")


>")

 do? Combining filters Color matching.>")


