Download presentation
Presentation is loading. Please wait.

1
Quality and Performance Improvement
4/26/2017 Quality and Performance Improvement HLNDV Study Group Summary May 1, 2013

2
Quality and Performance Improvement (19 of 200 questions)
Quality Benchmarking Medical staff peer review and disciplinary processes Risk management principles and programs (e.g., insurance, education, safety, injury management, patient complaint) Performance and process improvement (e.g., CQI, TQM, QA/QI) Customer satisfaction principles and tools Clinical pathways and disease management Utilization review and management regulations Source: Reference Manual Page 72 to 82 (
 Performance and process improvement (e.g., CQI, TQM, QA/QI) Customer satisfaction principles and tools. Clinical pathways and disease management. Utilization review and management regulations. Source: Reference Manual Page 72 to 82. (")
3
Part 1: Benchmarking Performance refers to output results obtained from processes and services that permit evaluation and comparison relative to goals, standards, past results, and other organizations Benchmarking- comparative process used by organizations to collect and measure internal or external data that may be used for the purpose of developing, implementing, and sustaining quality improvements

4
Benchmarking Techniques
Hospitals are under increasing pressure to reduce costs Hospital leaders have been intensifying efforts to identify the steps the organization needs to take to make a difference Can use publicly reported (Medicare) data for benchmarking The benchmarking analysis should seek to identify any unexpected differences related to similar or “like” hospitals It is important to select a peer group carefully i.e. teaching hospital to teaching hospital The one good thing about today’s economic challenges is that it has forced us to focus our collective attention to reduce costs and improve healthcare. A finding of higher than expected results should prompt further investigation Hospital Specific Medicare data can be found from the Medicare Provider Analysis and Review (MEDPAR) file to compare costs, etc…
 data for benchmarking. The benchmarking analysis should seek to identify any unexpected differences related to similar or like hospitals. It is important to select a peer group carefully i.e. teaching hospital to teaching hospital. The one good thing about today’s economic challenges is that it has forced us to focus our collective attention to reduce costs and improve healthcare. A finding of higher than expected results should prompt further investigation. Hospital Specific Medicare data can be found from the Medicare Provider Analysis and Review (MEDPAR) file to compare costs, etc…")
5
Sources of Comparative Measures
Patient Satisfaction –CMS HCAHPS Practice Patterns – Dartmouth Health Atlas Health Plans – NCQA (HEDIS) Clinical Indicators – CMS Quality Indicators Population Measures- State Health Departments, AHRQ (National Healthcare Quality Report)
 Clinical Indicators – CMS Quality Indicators. Population Measures- State Health Departments, AHRQ (National Healthcare Quality Report)")
6
Common sources for Benchmarking
U.S. Agency for Healthcare Research and Quality (AHRQ) State Snapshots A government tool created to help States improve healthcare quality Can see how the State performed overall on more than 100 quality measures Helps organizations develop programs, etc… Hospital Compare The Joint Commission Oryx data NACHRI (Pediatrics) Vermont-Oxford (NICU)
 State Snapshots. A government tool created to help States improve healthcare quality. Can see how the State performed overall on more than 100 quality measures. Helps organizations develop programs, etc… Hospital Compare. The Joint Commission Oryx data. NACHRI (Pediatrics) Vermont-Oxford (NICU)")
11
What are the Core Measures ?
Core measures are disease specific best practice measures. The measures are part of the performance measurement system developed by the JCAHO. The measures are publicly reported on the internet and are also utilized by Medicare to judge clinical quality.

12
Where do the Core Measures come from ?
The measures are developed based on best practice literature, medical association clinical recommendations, as well as the National Quality Forum, who is the recognized final pathway for the review and approval of performance measures. The measures are developed in a collaborative manner, tested and then subsequently approved for performance measurement.

13
What Measures are utilized for Performance Measurement ?
Congestive Heart Failure Pneumonia Acute Myocardial Infarction Pregnancy and Related Conditions Surgical Care Improvement Project

14
Congestive Heat Failure Core Measure
Discharge instructions specially prepared for CHF patients Including: activity, diet, weight monitoring, mediations, follow-up appointments, what do do if symptoms worsen Left Ventricular Assessment Ace Inhibitor / ARB at discharge for patients with LVEF <40% Smoking cessation counseling

16
A balanced scorecard is a set of performance measurements used to:
a. Assess patient satisfaction b. Ensure the organization does not exceed one performance metric at the expense of another c. Provide a scorecard for annual performance monitoring d. Gather and monitor financial data

20
One method for evaluating relative value of different jobs is:
a. Broad banding b. Gant charting c. Scalability d. Benchmarking

21
Which of the following are parts of the dimensions of the strategic balanced
scorecard? a. Financial performance b. New technology c. Competitor activity d. Board/management team

22
Part 2: Medical Staff Peer Review and Disciplinary Processes
TJC Standards: The Role of the Medical Staff “The organized medical staff has a critical role in the process of providing oversight of quality of care, treatment, and services. The organized medical staff is a self-governing body that is charged with overseeing the quality of care, treatment, and services delivered by practitioners who are credentialed and privileged through the medical staff process”

23
TJC Standards: Medical Staff and Hospital Governing Board
Must create and maintain a set of bylaws that defines its role “The hospital’s governing board has the ultimate authority and responsibility for the oversight and delivery of health care rendered by its LIPs and other practitioners credentialed and privileged through the medical staff process or any equivalent process.”

24
Standards: Disciplinary Processes
Medical Staff Bylaws must include: Corrective Action Description of the indications and procedures for automatic and summary suspension Description of mechanism to recommend medical staff membership and/or termination, suspensions, or reduction in privileges Fair Hearing A mechanism for a fair hearing and appeal procedure

25
TJC Standards: Role of Medical Staff Peers
“Peer recommendations from peers in the same professional discipline as the applicant are used as part of the basis for the initial granting of privileges.” “There is a process that defines circumstances requiring a focused review of a practitioner’s performance and evaluation of a practitioner by peers.” 4/26/2017

26
TJC Standards: Focused Performance Review
Define circumstances Method for selecting review panels Timeframes Define circumstances requiring external review Medical staff Involved in evaluation of individuals Communicate findings to appropriate parties Implement changes to improve performance 4/26/2017

27
Part 3: Risk Management Principles and Programs
TJC Standards: Principles of Risk Management Involve both clinical and administrative activities Most effective when pro-active, rather than reactive Include collecting data on potentially high risk processes

28
Risk Management Program
The internal risk management program is the responsibility of the governing board of the health care facility. Each licensed facility shall hire a risk manager, licensed under s , who is responsible for implementation and oversight of such facility’s internal risk management program as required by this section. A risk manager must not be made responsible for more than four internal risk management programs in separate licensed facilities, unless the facilities are under one corporate ownership or the risk management programs are in rural hospitals

29
Risk Management Principles
Which programs, departments, and activities in the organization are subject to risk management policies and procedures? Serve as a principle operational guide to prevent incidents Leadership emphasis on the importance of strict compliance, training and retraining for new employees Incident reports, insurance, universal precautions, exposure, workplace violence, fire alarms and prevention, weapons, hazardous substances, communication interruptions, and emergency evacuation A. All healthcare organizations customer and non-contact departments are involved

30
Risk Management Components
Define objectives Put into place structure and organization Employ information and reports Establish IT infrastructure Clarify and recognize roles and responsibilities Monitor- identify risks early. Mitigate, intervene, and control effectiveness

31
Contemporary Risk Management: Enterprise-wide
Enterprise Risk Management (ERM): A structured analytical process Focuses on identifying and eliminating the financial impact and Volatility of a portfolio of risks rather than on risk avoidance alone
: A structured analytical process. Focuses on identifying and eliminating the financial impact and. Volatility of a portfolio of risks rather than on risk avoidance alone.")
32
TJC Standards: Concepts Related to Risk Management
Safety Patient Environment of Care Sentinel Event Near Miss Root Cause Analysis

33
Complaint Management Systems
Prompt and effective resolution of complaints Recovery of patient/customer confidence Best resolved at the point of service to assure customer loyalty Must have a mechanism for learning from complaints and ensuring that staff receives the information needed to eliminate the underlying cause of the complaints Aggregation, analysis, and root cause determination leads to effective elimination of the cause if possible

34
Patient Safety Freedom from accidental injury
Adverse event- when a patient experiences harm or injury from a medical intervention Harm can be preventable. Often errors occur without harm reaching the patient (near miss) James Reason- Swiss cheese model of harm. When holes align harm can get thru layers of defensive barriers Error traditionally was blamed on the individual but really is considered a system problem. We need to fix the system/process, but also to hold individuals accountable to expectations- a just culture
 James Reason- Swiss cheese model of harm. When holes align harm can get thru layers of defensive barriers. Error traditionally was blamed on the individual but really is considered a system problem. We need to fix the system/process, but also to hold individuals accountable to expectations- a just culture.")
35
Patient Safety Tools Root Cause Analysis (RCA)- retrospective, investigative tool to identify and understand the root causes of an adverse event with a focus on processes and systems Failure Mode and Effects Analysis (FMEA)- proactive, preventative tool which provides a systematic way to ask: what has failed? What could fail and how? What are the consequences? Improvements are applied to prevent adverse events
- retrospective, investigative tool to identify and understand the root causes of an adverse event with a focus on processes and systems. Failure Mode and Effects Analysis (FMEA)- proactive, preventative tool which provides a systematic way to ask: what has failed What could fail and how What are the consequences Improvements are applied to prevent adverse events.")
36
The Joint Commission National Patient Safety Goals
Use at least two patient identifiers when providing care Eliminate transfusion errors related to patient misidentificaiton Report critical test results timely Reduce the likelihood of harm from use of anticoagulation therapy Comply with hand hygiene guidelines

37
The Joint Commission National Patient Safety Goals
Implement best practices to prevent central line associated blood stream infections Implement best practices to prevent surgical site infections Reduce the risk of falls Identify patients at risk for suicide A time out is performed before a procedure

38
The Joint Commission Sentinel Event
A “sentinel event” is an unexpected occurrence involving death or a serious physical or psychological injury, or the risk thereof. Serious injury specifically includes loss of limb or function. The phrase “or risk thereof” includes any process variation for which recurrence would carry a significant chance of a serious adverse outcome

39
The principles of quality improvement require that healthcare executives
change their management philosophy from: a. Finding fault with employees to finding problems in processes b. Finding fault with employees to involving them in the improvement of processes c. Focusing on enhanced inspection techniques to focusing on variance d. Focusing on employees’ roles to focusing on process outcomes

40
Which of the following would represent the most common cause of adverse
drug events (ADEs)? a. Lack of standardization b. Lack of knowledge of drug c. Preparation errors d. Transcription errors
 a. Lack of standardization. b. Lack of knowledge of drug. c. Preparation errors. d. Transcription errors.")
42
The single most important way patients can help prevent medical errors
from affecting them is to: a. Interact with their caregivers b. Research medical error rates among organizations c. Read and understand consent forms d. Choose large, reputable healthcare providers

43
Incident reports should be initiated by:
a. A member of the medical/professional staff or by any employee b. Any person with direct patient-care responsibilities c. The department director or supervisor d. The risk manager/quality assurance coordinator

45
Part 4: Performance Excellence
An integrated approach to organizational performance management that results in: Delivery of ever-improving value to patients and other customers, contributing to improvement healthcare quality Improvement of overall organizational effectiveness and capabilities as healthcare providers Organizational and personal learning Source:

46
Quality Improvement 1924 Walter Shewhart designed a tool to help guide the appropriate action to take in response to variation. The “Control Chart” can differentiate random (common cause) variation from assignable (special) causes W. Edwards Deming in the 1970s created his 14 Points. He also described the Plan-Do-Study(Check)- Act cycle
 variation from assignable (special) causes. W. Edwards Deming in the 1970s created his 14 Points. He also described the Plan-Do-Study(Check)- Act cycle.")
47
Quality Improvement Joseph M. Juran- described three interrelated processes: quality planning, quality control, and quality improvement. The Juran Trilogy Taiichi Ohno- developed the Toyota Production System (Lean). He described 7 categories of MUDA or waste. These don’t add value to the process. These include: overproduction, inventory, repairs/rejects, motion, processing, waiting, and transport
. He described 7 categories of MUDA or waste. These don’t add value to the process. These include: overproduction, inventory, repairs/rejects, motion, processing, waiting, and transport.")
48
Quality Improvement Crosby introduced the idea of “zero defects” in 1961 Feigenbaum originated the concept of TQC- Total Quality Control- excellence driven rather than defect driven. Three steps to Quality- Leadership, Technology, and Organizational Commitment Ishikawa- developed the Cause and Effect Diagram

49
Definitions Quality is always judged in comparison to economic limitations Quality of Care- degree to which health services increase the likelihood of desired health outcomes and are consistent with current professional knowledge Appropriate care- care for which expected health benefits exceed negative consequences

50
Terminology Quality Assurance - focuses on output
Quality Improvement - emphasizes prevention of error (also known as CQI – Continuous Quality Improvement) Quality Control - focuses on proper function of equipment
 Quality Control - focuses on proper function of equipment.")
51
Performance and Process Improvement
Quality Assurance Defining performance through the use of thresholds “Find and eliminate worst” Find faulty outputs & repair or disregard them

52
Quality Improvement: “Find and implement the best”
Find fault find solutions Find faulty processes & repair them so they do not produce faulty outputs

53
HEDIS The Healthcare Effectiveness Data and Information Set (HEDIS) is a tool used by more than 90 percent of America's health plans to measure performance on important dimensions of care and service NCQA website
 is a tool used by more than 90 percent of America s health plans to measure performance on important dimensions of care and service. NCQA website.")
54
Institute for Healthcare Improvement
The Model for Improvement (two parts): Three fundamental questions, which can be addressed in any order What are we trying to accomplish? How will we know if a change is an improvement? What changes can we make that will result in an improvement? The Plan-Do-Study-Act (PDSA) cycle used to test and implement changes in real work settings In BOG Manual = Plan Do Check Act IHI Website
: Three fundamental questions, which can be addressed in any order. What are we trying to accomplish How will we know if a change is an improvement What changes can we make that will result in an improvement The Plan-Do-Study-Act (PDSA) cycle used to test and implement changes in real work settings. In BOG Manual = Plan Do Check Act. IHI Website.")
55
Total Quality Management
“TQM is a philosophy or an approach to management that can be characterized by its principles, practices, and techniques. Its three principles are customer focus, continuous improvement, and teamwork …each principle is implemented through a set of practices…the practices are, in turn, supported by a wide array of techniques” Source: Dean JW and DE Bowen “Management Theory and Total Quality: Improving Research and Practice through Theory Development.” Academy of Management Review 19(2):
:")
56
Continuous Improvement
Assumes no upper limit of improvement Considers both elements outside of direct control and due to interactions in a complex system Assumes the customer’s perspective is dominant Focuses on overall group performance rather than identification and correction of outliers Requires organization-wide commitment

57
Performance and Process Improvement
Total Quality Management (TQM) Introduced in the late 1980’s Evolved into Continuous Quality Improvement (CQI) or Process Improvement (PI) Designed to be proactive, leading to the elimination of the underlying causes of defective work processes or processes that permit unwarranted variation Quality Assurance (QA) Tends to refer to the inspection process that evaluates conformance to standards, accuracy and other performance on an “after the fact” basis There is a synergistic relationship between QA and CQI QA= data input CQI= improvement project Both TQM and CQI are used interchangably
 Introduced in the late 1980’s. Evolved into Continuous Quality Improvement (CQI) or Process Improvement (PI) Designed to be proactive, leading to the elimination of the underlying causes of defective work processes or processes that permit unwarranted variation. Quality Assurance (QA) Tends to refer to the inspection process that evaluates conformance to standards, accuracy and other performance on an after the fact basis. There is a synergistic relationship between QA and CQI. QA= data input. CQI= improvement project. Both TQM and CQI are used interchangably.")
58
TQM/CQI Focuses on the system rather than the individual
The Joint Commission points out that the goal of improving organizational performance is to ensure that the organization designs processes well and systematically monitors, analyzes, and improves its performance to improve patient outcomes Quality Management must be embraced by the hospital leadership team in order for the right care to be provided by the front-line staff Process or statistical tools allow for analysis, measurement, and improvement Improving processes is appropriate in comparing evidence of compliance with medical quality standards, financial management, cost-control, customer satisfaction results, use of supplies, and many others. Rather than only analyzing with historic data, as quality assessment processes did, performance improvement processes chart routes for future improvement and measure success in implementation. While improvement has been used to improve clinical practices, it is equally useful in improving nonclinical processes and systems as well.

59
Core Values of C.I. Patient centered care Individualized response
Physician as patient’s agent Science as a guide- evidence based practice Change is a way of life Participation in decisions- no surprises Mutual respect Respect rules and processes

60
Quality Landmarks Institute of Medicine-
National Roundtable on Healthcare Quality Report 1998 To Err is Human 1999 Crossing the Quality Chasm 2001

61
Quality definition Quality care is the degree to which health services for individuals and populations increase the likelihood of desired health outcomes and are consistent with current professional knowledge To Err is Human- as many as 98,000 people die every year in hospitals as a result of injuries from their care. Total national costs of “preventable” adverse events are estimated at between $17-29 billion annually

62
Crossing the Quality Chasm- Six Aims
Safe care Effective Efficient- cost effective and free of waste Timely- no patient waits/delays Patient centered- system should revolve around the patient, respecting preferences and putting the patient in control Equitable- no disparities in treatment/access

63
Quality: Structure, Process, Outcomes
“Process”- what takes place during the delivery of care. Appropriateness- whether the right action was taken. Skill- how well the actions were carried out “Outcomes”- whether the goals of care were achieved. Come to include costs of care, patient satisfaction, and health related functional outcomes, including functional status or mortality

64
Structure, Process, Outcomes
Donabedian in1966 noted all evaluations of quality can be classified in terms of which three aspects of caregiving they measure: “Structure”- focus is on the static characteristics of the individuals who provide care and the settings where care is delivered Ex- education, training, certification of care providers and the adequacy of the facility’s staffing, equipment, and organization

65
Clinical Quality Measures
Example: childhood immunizations Structure Number / location of pediatric clinics Available vaccines (i.e. inventory) Process “What is done to a patient…” Immunization rates (ex. MMR) Outcomes “What happens to a patient…” Measles rates Source: Brook RH, Kamberg CJ, McGlynn EA. Health system reform and quality. JAMA 1996;276:
 Process. What is done to a patient… Immunization rates (ex. MMR) Outcomes. What happens to a patient… Measles rates. Source: Brook RH, Kamberg CJ, McGlynn EA. Health system reform and quality. JAMA 1996;276:")
66
Plan-Do-Check-Act Cycle
Seven basic tools used in TQM: Flowcharts Control charts Cause and effect diagrams Histograms Check sheets Pareto charts Scatter diagrams

67
Variation in healthcare
Variation is the difference between an observed event and a standard or norm The Dartmouth Atlas of Health Care Project in 2003 found that there was great regional variation in patients admitted to an intensive care unit, ranging from 23-45% without a discerning clinical reason Random variation- is a physical attribute of the process, adheres to probability, and can’t be traced to a root cause Assignable variation- arise from causes outside of the intrinsic process and can be traced, identified, and eliminated Performance variation- difference between any given result and the optimal or ideal result

68
Lean Thinking or the Toyota Production System
Removal of waste- anything not necessary to produce the product or service Emphasis on Flow Customer defines value- anything else is waste Five Steps: Identify which features create value Identify the sequence of activities, called value stream Make the activities Flow Let the customer pull the product through the process Perfect the Process

69
Six Sigma Developed by HP, Motorola, and GE
Aim is to reduce variation (eliminate defects) Uses statistical tools Five Steps: DMAIC Define Measure Analyze Improve Control
 Uses statistical tools. Five Steps: DMAIC. Define. Measure. Analyze. Improve. Control.")
70
Sigma = statistical term. Six sigma = 99. 99966% error free rate (3
Sigma = statistical term. Six sigma = % error free rate (3.4 defective products per million)
")
71
FOCUS-PDCA Model Find an opportunity for improvement
Organize an effort (assign a team) Clarify current understanding of the process Understand the process variation and capability Select a strategy for improvement The PDCA cycle tests the strategy to determine if it results in improvement
 Clarify current understanding of the process. Understand the process variation and capability. Select a strategy for improvement. The PDCA cycle tests the strategy to determine if it results in improvement.")
72
Kaizen Japanese word for “improvement” Includes concepts such as:
Customer orientation Quality control circles Automation Just in time Zero defects

73
Associates for Process Improvement (API) Improvement Model
Three questions- What are we trying to accomplish? How will we know that a change is an improvement? What changes can we make that will result in improvement? These are used to run a test of change using the PDSA (Plan Do Study Act) cycle
 cycle.")
74
Baldrige The goal of the Malcolm Baldrige National Quality Improvement Act of 1987 was to enhance the competitiveness of U.S. businesses Its scope was expanded to health care and education organizations (in 1999) and to nonprofit/government organizations (in 2005) Source:
 and to nonprofit/government organizations (in 2005) Source:")
75
Baldrige Criteria categories
Leadership Strategic Planning Focus on patients, customers, markets Measurement, analysis, and knowledge management Staff focus Process Management Organizational Performance results

76
The basic tools used in CQI are:
Flowcharts, Control charts, Cause-and-effect diagrams, Histograms, Check sheets, Pareto charts, Scatter diagrams

77
Quality Tools Flowchart- map of each step of a process, in the correct sequence Cause and Effect diagram- Ishikawa or Fish-bone. The problem (effect) is stated in a box on the right side of the chart and likely causes are listed around major headings (bones) that lead to the effect Pareto Chart- is a display of the frequency of occurrences that helps to show the vital few contributors to a problem so management can concentrate on correcting them. 80% of the variation in any process is likely caused by only 20% of the variables
 is stated in a box on the right side of the chart and likely causes are listed around major headings (bones) that lead to the effect. Pareto Chart- is a display of the frequency of occurrences that helps to show the vital few contributors to a problem so management can concentrate on correcting them. 80% of the variation in any process is likely caused by only 20% of the variables.")
78
Quality Tools Run Chart- plots of data arranged chronologically. Used to determine causes of special cause variation using a center line as the mean Control Chart- chronological data along with upper and lower control limits defining the limits of common cause variation. Used to monitor and analyze variation from a process to see if stable and predictable or unstable and unpredictable

79
Quality Tools Histogram- a graphical display of the frquency distribution of the quality characteristic of interest FMEA- Failure Mode and Effects Analysis- method for looking at potential problems and their causes as well as predicting undesired results

80
Improvement Tools and Techniques

81
Fishbone – root cause

82
Pareto chart Use to show the frequency of problems or causes in a process.

83
Dashboards and Scorecards
Dashboard- a real time/current indicator panel to monitor key performance metrics Scorecards- record and report prior-period or past performance rather than real time performance The key issue is how these are used by leadership to align priorities and achieve desired organizational results

84
Dashboards and Scorecards
Senior leadership uses measurement to align organizational effort and achieve higher levels of organizational performance Kaplan and Norton introduced the “Balanced Scorecard”- creates a balance between financial and other important dimensions of organizational performance. These often include quality, service, customers, as well as finance

85
IT and Quality Information technology has tremendous effect/potential on Quality: Internet and connectivity to information/education. Clinical Decision Support systems Electronic Medical Records Clinical and Administrative Databases- help with analyzing data, sharing best practice, order sets, and predictive modeling. Computerized Physician Order Entering- can help decrease errors

86
Theory of Constraints Focuses on system improvements to maximize customer value while minimizing expense The strength of the process is limited by its weakest link. TOC concentrates on the process that slows the speed of product through the system

87
Which is the Shewhart process for performance improvement?
a. Plan, check, do, act b. Plan, do, check, act c. Analyze, formulate, implement, evaluate d. Analyze, implement, control, evaluate

88
Continuous quality improvement assumes that:
a. Achievement will be rewarded b. There is direction from top management c. There is no upper limit to excellence d. Interconnected work teams are in place

91
Performance improvement teams should consist of:
a. Experts in process management b. Members from the involved Microsystems c. Middle managers with experience d. Physicians and other users

99
A bar chart format, with the items rank ordered on a dependent variable,
such as cost, profit, or satisfaction that Examines the components of a problem in terms of their contribution to it is known as: a. A run chart b. A frequency table c. Pareto analysis d. Deming cycle

104
Clinical quality measures include: Structure, Process, and Outcomes
Process, Outcomes, and Efficiency Economy, Efficiency, and Structure Outcomes, Economy and Efficiency Answer: A. Structure, process and outcomes. 4/26/2017

106
Cause and Effect Diagram
A bar graph that ranks the data in descending order from left to right is the definition of: Pareto Chart Fishbone Diagram Check Sheet Cause and Effect Diagram Answer: A. Answers B and D, Fishbone Diagram and Cause and Effect Diagram refer to the same tool, which identify and organize possible causes of a problem. Answer C is a simple data collection tool utilizing tally marks to identify how often something occurs. All are tools used to identify problems. 4/26/2017

107
Quality Improvement emphasizes: Outcomes Processes Prevention
Proper function of equipment Answer: C. Prevention. Quality Assurance focuses on output. Quality Control focuses on the proper functioning of equipment in the organization. 4/26/2017

108
Which of the following is not a principle of total quality?
Customer focus Continuous Improvement Medical Quality Teamwork Answer: C 4/26/2017

109
In an internal medicine practice the measure of the percent of elderly patients appropriately receiving an influenza vaccine is considered an example of a: Process measure Outcome measure Capacity measure Structure measure Answer: A. Concepts of Quality Management 4/26/2017

110
Part 5: Customer Satisfaction Principles and Tools
Definitions Customer: Anyone who has expectations regarding a process’s operation or outputs Patients Internal customers: within your organization External customers: outside your organization Stakeholder: Anyone who is interested in or is affected by the work you do Market: The environment in which you operate and do business

111
Customer Satisfaction Principles and tools
Customers (a.k.a stakeholders) include patients, families, physicians, payers, business, community organizations, and schools Employees of healthcare organizations must develop effective listening skills and there must be investment in frequent customer satisfaction survey methods The number one survey used is the H.C.A.H.P.S. inpatient survey as it is publicly reported and Medicare reimbursement will be affected by poor scores A.H.C.A. now places detailed reports of complaint investigations on the web for consumer review Ask for other examples of customers
 include patients, families, physicians, payers, business, community organizations, and schools. Employees of healthcare organizations must develop effective listening skills and there must be investment in frequent customer satisfaction survey methods. The number one survey used is the H.C.A.H.P.S. inpatient survey as it is publicly reported and Medicare reimbursement will be affected by poor scores. A.H.C.A. now places detailed reports of complaint investigations on the web for consumer review. Ask for other examples of customers.")
112
Transparency Ability to judge care, costs and satisfaction from outside the organization by viewing published elements that paint a picture of supposed competency The more transparent the data and information are the better consumers and stakeholders will be able to compare and make decisions regarding care BOG Exam Reference Manual

113
CAHPS The National Committee for Quality Assurance (NCQA) requires all health plans to submit Consumer Assessment of Health Plans (CAHPS) data as part of their Health Employer Data and Information Set (HEDIS) for accreditation. In the Hospital setting the CAHPS is called HCAHPS for Hospital Consumer Assessment of Health Plans. These are used today to gauge Patient Satisfaction with their hospital care
 requires all health plans to submit Consumer Assessment of Health Plans (CAHPS) data as part of their Health Employer Data and Information Set (HEDIS) for accreditation. In the Hospital setting the CAHPS is called HCAHPS for Hospital Consumer Assessment of Health Plans. These are used today to gauge Patient Satisfaction with their hospital care.")
114
Patient Expectations: Picker Institute (dimensions of care)
4/26/2017

115
Leapfrog Group “In an effort to improve predictability, some businesses have joined to create organizations such as the Leapfrog Group, an organization representing close to 40 million people, to mandate certain processes be initiated to improve quality for their constituents.” BOG Exam Manual

116
Resources https://www.cahps.ahrq.gov http://www.hcahpsonline.org
117
Pay-for-performance CMS initiative rewards hospitals that show improvement in specific areas compared to other hospitals The reward can come in the form of getting the entire Medicare payment or getting additional money from hospitals that were penalized and didn’t show improvement One area where pay-for-performance may be used is in measuring customer satisfaction with the Consumer Assessment of Healthcare Providers and Systems Hospital Survey (H-CAHPS), mandated by CMS BOG Exam Reference Manual
, mandated by CMS. BOG Exam Reference Manual.")
118
Part 6: Clinical Pathways and Disease Management
Definitions Evidence-based medicine Evidence-based management Evidence-based performance

119
Evidence Based Medicine
The conscientious, explicit and judicious use of current best evidence in making decisions about the care of individual patients. The practice of evidence- based medicine means integrating individual clinical expertise with the best available external clinical evidence from systematic research

120
Clinical (Care) Pathways
A methodology for the mutual decision making and organization of care for a well-defined group of patients during a well-defined period Aim is to enhance the quality of care by improving patient outcomes, promoting patient safety, increasing patient satisfaction, and optimizing the use of resources

121
Clinical Practice Guidelines
Are systematically developed statements to assist practitioners and patient decisions about appropriate healthcare for specific clinical circumstances Examples can be found on the Internet in the Agency for Healthcare Research and Quality (AHRQ) established National Guideline Clearinghouse (NGC)
 established National Guideline Clearinghouse (NGC)")
122
Clinical methodologies
Clinical pathways Reduction in length of stay Increased patient satisfaction Evidenced-based medicine Compliance with regulatory guidelines Maintains standard of care Population health The effects of healthcare reform Pay for Performance Value-Based purchasing

123
More Definitions Protocols- determine how functional elements of care are carried out Care Plans- expectations for the care of “individual” patients based on evaluation of their needs- aggregates of functional protocols Care Guidelines/Pathways- formally established expectations that define the normal steps or processes in the care of a clinically related “group” of patients The professional is always considering the modification of the expectation to the individual needs

124
Protocols Developing thru consensus helps buy-in
Should be reviewed regularly for updates Should include provisions for the attending physician to justify exceptions

125
Protocols improve processes by:
Eliminating unnecessary or redundant tasks (waste) Alerting for tasks previously overlooked or omitted Standardizing supplies with savings Substituting lower-cost personnel for specific activities Reducing errors or delays Reengineering the care process
 Alerting for tasks previously overlooked or omitted. Standardizing supplies with savings. Substituting lower-cost personnel for specific activities. Reducing errors or delays. Reengineering the care process.")
126
Success factors for clinical change
Organizational capabilities for change Infrastructure for implementation Implementation strategies Medical group characteristics Guideline characteristics External environment

127
Barriers to Physician Adherence to Guidelines
Knowledge Attitude Lack of familiarity Lack of awareness Lack of agreement with guidelines- both specific and general Lack of motivation Patient and environmental factors- lack of time, resources, etc…

128
Prevention and Health Promotion
Prevention- direct interventions to avoid or reduce disease or disability Health promotion- all activities to change patient or customer behavior Primary prevention- activities before the disease occurs that eliminate or reduce its occurrence Secondary prevention- reduces the consequences of disease, often by early detection and treatment Tertiary prevention- avoidance of complications or sequellae Cost effectiveness can be improved by reducing the intervention costs or the adverse consequences or by increasing the effectiveness of the preventive intervention

129
Successful approach: A mechanism to develop a local, evidence-based consensus on care Well-designed processes to implement that consensus A deliberate program of outreach to the community on disease prevention and health promotion A system to review actual performance and identify future improvement Source: Griffith

131
In a hospital setting, a critical pathway is best described as:
A document that focuses on efficiency and describes a standard set of activities to be performed for a defined category of patients b. A set of guidelines that focus on identifying those decision points which should lead to the consistent provision of appropriate clinical practice c. Any attempt to standardize clinical activities based upon diagnostic categories and projected outcomes d. Decision tree that focuses on physician decision making

132
Part 7: Utilization Review and Management Regulations
Public: Local rules and regulations governing hospitals and other healthcare delivery organizations (ex. building codes) State rules and regulations governing hospitals and other healthcare delivery organizations (ex. licensure, environmental, insurance) Federal rules and regulations governing hospitals and other healthcare delivery organizations (i.e. CMS, OSHA, FDA) Private: NCQA
 State rules and regulations governing hospitals and other healthcare delivery organizations (ex. licensure, environmental, insurance) Federal rules and regulations governing hospitals and other healthcare delivery organizations (i.e. CMS, OSHA, FDA) Private: NCQA.")
133
Utilization Management
Utilization Review- Pre-admission Concurrent review Outpatient review Case Management Physician Gate-Keeping

134
Definitions Efficiency- maximization of the quality of a comparable unit of healthcare delivered for a given unit of health resources used

135
Utilization Review Purpose in hospitals and related healthcare organizations has expanded Length of stay Clinical pathways Disease management Care coordination Discharge planning Data gathering Process improvement Discuss most recent initiative to reduce HF readmissions through care coordination

136
National Quality Initiative
The Joint Commission- Accreditation proces National Patient Safety Goals Sentinel Events The Leapfrog Group CMS- Conditions for participation Quality Reporting/Transparency Pay for Reporting/Pay for Performance

137
National Quality Initiatives
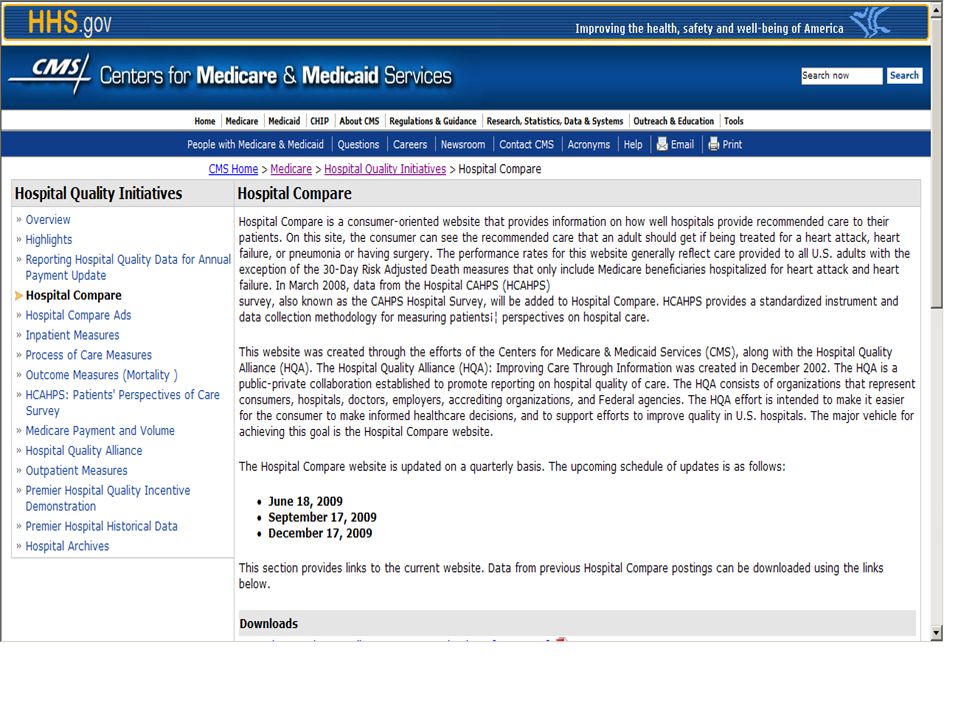
The Hospital IQR program is intended to equip consumers with quality of care information to make more informed decisions about healthcare options. It is also intended to encourage hospitals and clinicians to improve the quality of inpatient care provided to all patients. The hospital quality of care information gathered through the program is available to consumers on the Hospital Compare website There are a total of 23 quality of care measures for hospitals participating in the Hospital Outpatient Quality Reporting (OQR) Program. The quality of care measures, listed below, include 14 clinical performance measures, seven Medicare fee-for-service claims-based measures, and two structural measures Hospital Value-Based Program (VBP)aims to encourage hospitals to improve the quality and safety of care that Medicare beneficiaries and all patients receive during acute-care inpatient hospital stays. Hospital VBP will do so by motivating hospitals to: Eliminate or reduce the occurrence of adverse events. Adopt care standards and protocols that medical evidence shows result in the best outcomes for the most patients Re-engineer hospital processes at all levels in ways that improve patients’ experience of care
 Program. The quality of care measures, listed below, include 14 clinical performance measures, seven Medicare fee-for-service claims-based measures, and two structural measures. Hospital Value-Based Program (VBP)aims to encourage hospitals to improve the quality and safety of care that Medicare beneficiaries and all patients receive during acute-care inpatient hospital stays. Hospital VBP will do so by motivating hospitals to: Eliminate or reduce the occurrence of adverse events. Adopt care standards and protocols that medical evidence shows result in the best outcomes for the most patients. Re-engineer hospital processes at all levels in ways that improve patients’ experience of care.")
138
The Joint Commission 2002 Shared Visions-New Pathways: shift from preparing for survey to continuous systematic improvement/continuous compliance 2004 New Hospital Accreditation Process- Revised standards Targeted process based on organization’s data Online standards compliance documentation Electronic communication Tracer methodology

139
Medical records (TJC) Must contain sufficient information to identify the patient and to support the diagnosis and treatment Must furnish adequate documentation of results Include medical history, diagnostic and therapeutic orders, all reports, consultations, tests, progress notes and clinical resume entered and signed by the attending physician Failure to maintain complete, accurate and current records has adverse effects for defendants in malpractice litigation BOG Exam Manual

140
“Accountability Measures — Using Measurement to Promote Quality Improvement”
In 2002, accredited hospitals were required to collect and report data on performance for at least two of four core measure sets (acute myocardial infarction, heart failure, pneumonia, and pregnancy) Hospitals provide data to the Joint Commission from a selection of 57 inpatient measures; currently, 31 of these are publicly reported Example: in 2009, 96.8% of hospitals showed performance levels greater than 90% in administering beta-blockers at discharge to patients who had had an acute myocardial infarction, as compared with 49.1% in 2002 Mark R. Chassin, M.D., M.P.P., M.P.H., Jerod M. Loeb, Ph.D., Stephen P. Schmaltz, Ph.D., and Robert M. Wachter, M.D.,N Engl J Med 2010; 363: August 12, 2010
 Hospitals provide data to the Joint Commission from a selection of 57 inpatient measures; currently, 31 of these are publicly reported. Example: in 2009, 96.8% of hospitals showed performance levels greater than 90% in administering beta-blockers at discharge to patients who had had an acute myocardial infarction, as compared with 49.1% in Mark R. Chassin, M.D., M.P.P., M.P.H., Jerod M. Loeb, Ph.D., Stephen P. Schmaltz, Ph.D., and Robert M. Wachter, M.D.,N Engl J Med 2010; 363: August 12,")
141
Continuous Improvement Process
Insight into process> measurement of current process outcomes> comparison to benchmark expectations> PDCA> redesign work process, change motivation and incentives, and new training and education These all lead to changing clinical behavior Participation and empowerment are critical components of the process

142
Decision Theory- routes to improving Quality
Increasing the value of intervention Reducing the cost of intervention Improving the selection of intervention Reducing the cost of delay

143
Premises to control cost and quality
The community at large must establish the desired level of economy Community decisions require input and advice from healthcare professionals The control of cost and quality depends on the entire institutional infrastructure Cost and quality is affected by the array of services selected- this can be stabilized by a clinical improvement program building consensus providing each patient with optimal treatment

144
Study Questions For the Quality Indicators discussion, the best definition for Effectiveness is: the ability to provide the desired effect how well an approach or process taking place in the usual practice setting accomplishes its intended purpose ratio of outputs to inputs how well things are done compared to a standard Answer: B. Efficacy is defined by A; Productivity is defined by C; Efficiency is defined by D. 4/26/2017

145
The hospital's governing board The Chief Medical Officer
According to JCAHO standards, "...the ultimate authority and responsibility for the oversight and delivery of healthcare rendered..." belongs to : The CEO The hospital's governing board The Chief Medical Officer The General Counsel Answer: B. The hospital's governing board 4/26/2017

148
Medicare DRG payment is highly dependent upon a hospital’s case mix
index. This index represents the average relative weight for all Medicare patients treated in a: a. Specific nursing unit or specialty area b. Specific period c. Common geographic market d. Specific facility

149
The applicability of continuous improvement in healthcare organizations
assumes: a. An upper limit of improvement b. The physician’s perspective is dominant c. An organizational commitment d. The elimination of outliers

150
Additional Sample Questions
4/26/2017

151
Which of the following is an output-related performance measure?
a. Provider productivity b. Board satisfaction c. Customer loyalty index d. Paid nursing hours

152
In order to verify that an instrument is reporting the correct values for quantitative lab tests, the laboratory often uses graphs known as "Levy-Jennings charts" to document daily results obtained from assaying a product that contains a known amount of glucose (or calcium, magnesium, etc.). Those charts are best described as: QA QC QI Answer: B. 4/26/2017

164
Which of the following networks is intended to reduce costs and improve
quality by giving access to financial, clinical and administrative information? a. Community health information network (CHIN) b. Local area health network (LAHN) c. Virtual private health network (FPHN) d. Health file transfer network (HFTN) Which of the following networks is intended to reduce costs and improve quality by giving access to financial, clinical and administrative information? a. Community health information network (CHIN) b. Local area health network (LAHN) c. Virtual private health network (FPHN) d. Health file transfer network (HFTN)
 b. Local area health network (LAHN) c. Virtual private health network (FPHN) d. Health file transfer network (HFTN) Which of the following networks is intended to reduce costs and improve. quality by giving access to financial, clinical and administrative. information a. Community health information network (CHIN) b. Local area health network (LAHN) c. Virtual private health network (FPHN) d. Health file transfer network (HFTN)")
165
What is a primary reason for conducting continuing education for staff?
a. Staff will think the organization cares about them b. There are significant short-term operating efficiencies c. It is a long-term commitment to the patient d. The Joint Commission and NCQA required it

167
You are planning to conduct an assessment of the utilization patterns in
your organization’s emergency department over the past three years. Which of the following techniques would be most appropriate? a. Strategic Planning b. Trend Analysis c. Situational Analysis d. Survey Research

168
The arrival of women for obstetrical deliveries or patient flow in an
emergency department can best be analyzed through the use of which technique? a. Pert Charting b. Stochastic Modeling c. Gant Charting d. Monte Carlo Simulation

169
One approach for measuring technical quality of clinical support services
is: a. Patient satisfaction scores b. Degree of continuity of care c. Appropriateness testing d. Process review

176
Summary Provided an overview of topics not covered in depth in the readings: Benchmarking techniques Medical staff peer review and disciplinary processes Risk management principles and programs Utilization review and management regulations Highlighted topics found in the recommended readings: Performance and process improvement Customer satisfaction principles and tools Clinical pathways and disease management 4/26/2017

177
References and Resources
The Well Managed Healthcare Organization by John Griffith and Ken White Applying Quality Management in Healthcare: A Process for Improvement by Diane L. Kelly Additional Resources: 4/26/2017

178
Resources Related to Quality
Agency for Healthcare Research and Quality (AHRQ), American Association of Homes and Services (AAHSA), American Healthcare Association (AHCA), American Hospital Association (AHA), American Medical Association (AMA), American Society for Quality (ASQ), Centers for Medicare and Medicaid Services (CMS), Delmarva Foundation (DF), Healthcare Quality Certification Board (CPHQ), Institute for Quality Improvement (IHI), Joint Commision on Accreditation of Healthcare Organizations (JCAHO), Journal of the American Medical Association (JAMA), National Association for Healthcare Quality (NAHQ), National Committee for Quality Assurance (NCQA), National Quality Forum (NQF), 4/26/2017
, American Association of Homes and Services (AAHSA), American Healthcare Association (AHCA), American Hospital Association (AHA), American Medical Association (AMA), American Society for Quality (ASQ), Centers for Medicare and Medicaid Services (CMS), Delmarva Foundation (DF), Healthcare Quality Certification Board (CPHQ), Institute for Quality Improvement (IHI), Joint Commision on Accreditation of Healthcare Organizations (JCAHO), Journal of the American Medical Association (JAMA), National Association for Healthcare Quality (NAHQ), National Committee for Quality Assurance (NCQA), National Quality Forum (NQF), 4/26/2017.")
Similar presentations


>")


![[Hospital Name | Presenter name and title | Date of presentation]](/19/5722524/big_thumb.jpg "[Hospital Name | Presenter name and title | Date of presentation]>")


