Download presentation
Presentation is loading. Please wait.

1
Estimation of growth within stock assessment models: implications when using length composition data Jiangfeng Zhu a, Mark N. Maunder b, Alexandre M. Aires-da-Silva b, Yong Chen c a. College of Marine Sciences, Shanghai Ocean University, China; b. Inter-American Tropical Tuna Commission, La Jolla, CA, USA c. School of Marine Sciences, University of Maine, Orono, USA Growth Workshop, La Jolla, CA, USA. November 3-7, 2014

2
Content Motivation Methods i. Sensitivity analysis - influences of growth parameters; ii. Simulation analysis - estimate growth par within stock assessment models; Results and discussion

3
Motivation Growth modeling is generally considered the most certain biological process; Growth parameters/curves usually estimated outside stock assessment models; However, estimates of growth may be problematic due to, e.g. difficulty in aging old individuals using otoliths, inconsistence resulted from different methods/hard parts (scales, otoliths, and mark-recapture data)
.")
4
The objective of this study (1) Illustrate the influence of mean length-at-age (MLAA) and variation in length-at-age (VLAA) in conjunction with length composition on management quantities, using sensitivity analysis; (2) Test if MLAA and VLAA can be estimated reliably inside the stock assessment model, using simulation analysis.
 Illustrate the influence of mean length-at-age (MLAA) and variation in length-at-age (VLAA) in conjunction with length composition on management quantities, using sensitivity analysis; (2) Test if MLAA and VLAA can be estimated reliably inside the stock assessment model, using simulation analysis.")
5
Methods - Sensitivity analysis for the impact of growth Model: Bigeye tuna stock assessment model (Aires da Silva and Maunder, 2012) ; Developed with stock synthesis 3; Include 23 fisheries from 1975-2011 (2 longline fisheries catching large tunas); Use VBGF with L1, L2, K, and CVs Put 10% higher and lower for the value of base case (L2=185.5 cm and CV=12.04 for both old female and old male), Asymptotic and dome shape longline selectivity Resulting in 18 cases.
 ; Developed with stock synthesis 3; Include 23 fisheries from (2 longline fisheries catching large tunas); Use VBGF with L1, L2, K, and CVs Put 10% higher and lower for the value of base case (L2=185.5 cm and CV=12.04 for both old female and old male), Asymptotic and dome shape longline selectivity Resulting in 18 cases.")
6
Methods - Sensitivity analysis for the impact of growth Model No.L2CV of old age classSelectivity curve of LL fisheries 1Lower Asymptotic 2BaseLowerAsymptotic 3HigherLowerAsymptotic 4LowerBaseAsymptotic 5Base Asymptotic 6HigherBaseAsymptotic 7LowerHigherAsymptotic 8BaseHigherAsymptotic 9Higher Asymptotic 10Lower Dome shape 11BaseLowerDome shape 12HigherLowerDome shape 13LowerBaseDome shape 14Base Dome shape 15HigherBaseDome shape 16LowerHigherDome shape 17BaseHigherDome shape 18Higher Dome shape

7
Methods - simulation analysis for estimating growth Model: Simplified Bigeye tuna SS3 model (Aires da Silva and Maunder, 2012) ; SS3 as simulator and estimator; Only includes 2 fisheries (longline and purse seine); 20 scenarios, in terms of L1, L2, K, CVs for old female, young female, old male and young male, and selectivity curve for LL; 100 data sets were generated for each scenario.
 ; SS3 as simulator and estimator; Only includes 2 fisheries (longline and purse seine); 20 scenarios, in terms of L1, L2, K, CVs for old female, young female, old male and young male, and selectivity curve for LL; 100 data sets were generated for each scenario.")
8
Simulator Estimator ScenarioGrowth parameter Longline selectivity L2L1, K CV old, CV young Longline selectivity CV old male 1asymptoticestfix asymptotic 2 L120.5 cm asymptoticfix estasymptotic 3 estfixestasymptotic 4 L2185.5 cm asymptoticest fixasymptotic 5 est asymptotic 6 K0.068 per asymptoticestfix dome 7 year asymptoticfix estdome 8 CV for 12.04 asymptoticestfixestdome 9 old female asymptoticest fixdome 10asymptoticest dome 11 CV for 1.95 domeestfix asymptotic 12 young female domefix estasymptotic 13domeestfixestasymptotic 14 CV for 12.04 domeest fixasymptotic 15 old male domeest asymptotic 16domeestfix dome 17 CV for 1.95 domefix estdome 18 young male domeestfixestdome 19domeest fixdome 20 domeest dome

9
Methods - simulation analysis for estimating growth The performance of the estimation model was quantified by comparing the estimates from the 100 simulated data sets with the true value in the simulator, using (1) the median relative bias of the estimates: (2) the variability (coefficient of variation or c.v.) of estimates, which captures both bias and imprecision.
 the median relative bias of the estimates: (2) the variability (coefficient of variation or c.v.) of estimates, which captures both bias and imprecision.")
10
Result of sensitivity analysis Models 10, 13 and 16 not converge Asymptotic Dome CV-old lowCV-old baseCV-old high L2 low L2 base L2 high

11
Result of sensitivity analysis Generally, all the five management quantities impacted by L2 and CV-old, but L2 impacts much larger than CV-old; When assuming asymptotic selectivity curves for LL (Models 1-9), the MSY, SSB MSY /SSB 0, C recent /MSY, and F multiplier varied relatively moderately, compared with SSB recent /SSB MSY. Results are sensitive to the dome shape selectivity and some results have an opposite trend

12
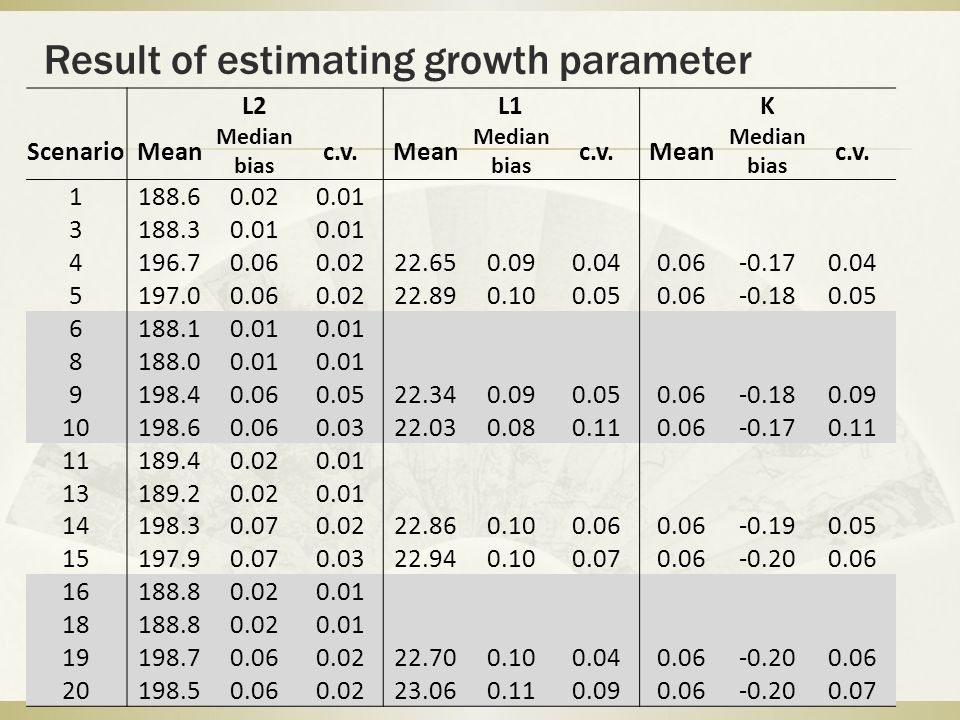
Result of estimating growth parameter L2L1K ScenarioMean Median bias c.v.Mean Median bias c.v.Mean Median bias c.v. 1188.60.020.01 3188.30.01 4196.70.060.0222.650.090.040.06-0.170.04 5197.00.060.0222.890.100.050.06-0.180.05 6188.10.01 8188.00.01 9198.40.060.0522.340.090.050.06-0.180.09 10198.60.060.0322.030.080.110.06-0.170.11 11189.40.020.01 13189.20.020.01 14198.30.070.0222.860.100.06 -0.190.05 15197.90.070.0322.940.100.070.06-0.200.06 16188.80.020.01 18188.80.020.01 19198.70.060.0222.700.100.040.06-0.200.06 20198.50.060.0223.060.110.090.06-0.200.07
13
Result of estimating growth parameter CV female youngCV female oldCV male old ScenarioMean Median bias c.v.Mean Median bias c.v.Mean Median bias c.v. 22.170.100.1410.23-0.190.2015.040.190.14 32.150.080.1310.11-0.200.2414.120.180.20 51.68-0.130.1911.89-0.030.2514.350.16 72.110.100.1111.14-0.070.1614.560.180.15 82.180.080.1512.11-0.160.8114.830.140.61 101.87-0.060.2013.760.050.3411.490.050.32 122.190.10 11.62-0.050.3214.670.180.20 132.150.100.1211.43-0.090.2512.930.100.23 151.82-0.030.1911.66-0.040.3114.120.140.24 172.160.100.1111.37-0.090.2515.100.200.16 182.180.100.1411.41-0.080.3113.500.120.23 201.75-0.090.2613.600.080.3212.980.060.24 c.v. larger than 0.20 are highlighted.

14
Result of estimating growth parameter Estimates of L2 were found reliable, and robust to misspecification of LL selectivity; Estimates of L2 were slightly more biased and variable when estimating L1 and K, but not when estimating CVs L1 was estimated with moderate median bias and low c.v.; K was estimated with large median biases and low c.v.; Estimates of L1 and K are only slightly affected by estimating the CVs. The estimates were only slightly effected by dome shape selectivity

15
Result of estimating growth parameter The CVs were estimated with bias and variation even when the true parameters were known for the other growth parameters CVs for young tunas were estimated with moderate median biases and c.v., except for Scenario 20 with c.v. = 0.26; CVs for old tunas were not considered to be reliably estimated. The estimates of CVs for young tunas had more variability and showed opposite bias when L1 and K were estimated.

16
Discussion L2 impacted management quantities largely, However, L2 can be estimated reliably. Therefore, it is better to treat L2 as free parameter and estimate it within the stock assessment models. Management quantities were lightly impacted by CV-old, in particular when L2 is high. Considering that CV-old may not be reliably estimated, it should be fixed before fitting stock assessment model.

17
The end.

18
Result of sensitivity analysis When asymptotic selectivity was assumed and L2 was kept higher, CV-old impact little on the five quantities (Models 3, 6, 9). When dome-shaped selectivity was assumed and L2 was constant, CV-old impact little on the five quantities (Models 11, 14, 17, and Models 12, 15, 18).
..")
19
Result of sensitivity analysis Models 10, 13 and 16 not converge

Similar presentations
 Photo from: www.incognitolighttackle.com/photos.htm.>")
 17-20 OCTOBER 2006.>")


 ANDRÉ E PUNT, MALCOLM.>")


 Center for the Advancement of Population.>")


