Download presentation
Presentation is loading. Please wait.

1
Are the apparent rapid declines in top pelagic predators real? Mark Maunder, Shelton Harley, Mike Hinton, and others IATTC

2
Outline Definitions and terms Why the declines don’t make sense –Japanese longline catch and effort (EP0) –Population dynamics Explanatory hypotheses –Regime change –Ecosystem –Spatial distribution of effort – Habitat and gear distribution –Stupid fish hypothesis Summary
 –Population dynamics Explanatory hypotheses –Regime change –Ecosystem –Spatial distribution of effort – Habitat and gear distribution –Stupid fish hypothesis Summary")
3
Definitions CPUE = catch-per-unit-of-effort Nominal CPUE Fitting a model Carrying capacity – Average abundance in the absence of fishing

4
Basic assumption C = EqA C/E = qA Where: C= catch, E = effort, and A = abundance

8
Fit model to data PellaTomlinson-model with N msy /N 0 = 30% (based on numbers) Project population dynamics from an unexploited condition using observed catch Fit to CPUE data as a relative abundance index (assume CPUE proportional to abundance) Use only Japanese longline CPUE and Catch data
 Project population dynamics from an unexploited condition using observed catch Fit to CPUE data as a relative abundance index (assume CPUE proportional to abundance) Use only Japanese longline CPUE and Catch data")
11
Remove first few data points

12
Only fit to decline

13
Regime change hypothesis

14
Blue marlin production residuals

15
Change in productivity, yellowfin example Maunder 2002. IATTC Stock Assessment Report 3

16
Change in productivity, bigeye example Maunder and Harley 2002. IATTC Stock Assessment Report 3

17
Ecosystem model High Adult BiomassLow Adult Biomass

18
Ecosystem model K = carrying capacityN = numbersf(N) is the single species production
 is the single species production")
19
Ecosystem results Fits the data significantly better Nearly all improvement from fit to bluefin tuna data Also improves fit to blue marlin data

20
Bluefin tuna Single Species Ecosystem

21
Blue marlin Single Species Ecosystem

22
Spatial expansion of the longline fishery

23
Spatial hypotheses Time Highest CPUE Highest ProfitEqual distribution

24
Simulation of effort expansion Effort increases by 100 units every 5 years Movement of effort only occurs every five years No movement of fish among areas In highest profit hypothesis, new effort goes into new area and old effort stays in the same area In highest CPUE hypothesis, all effort goes into new area

25
CPUE trends

26
Expansion of the fishery

27
30% of striped marlin catch

28
Limited stock distribution: striped marlin

29
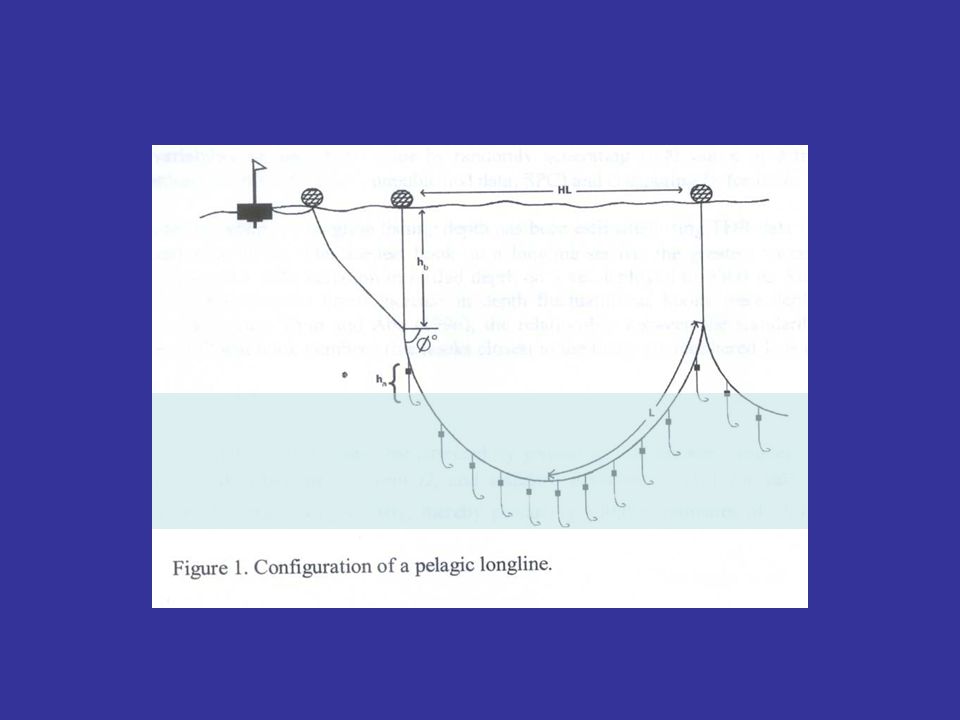
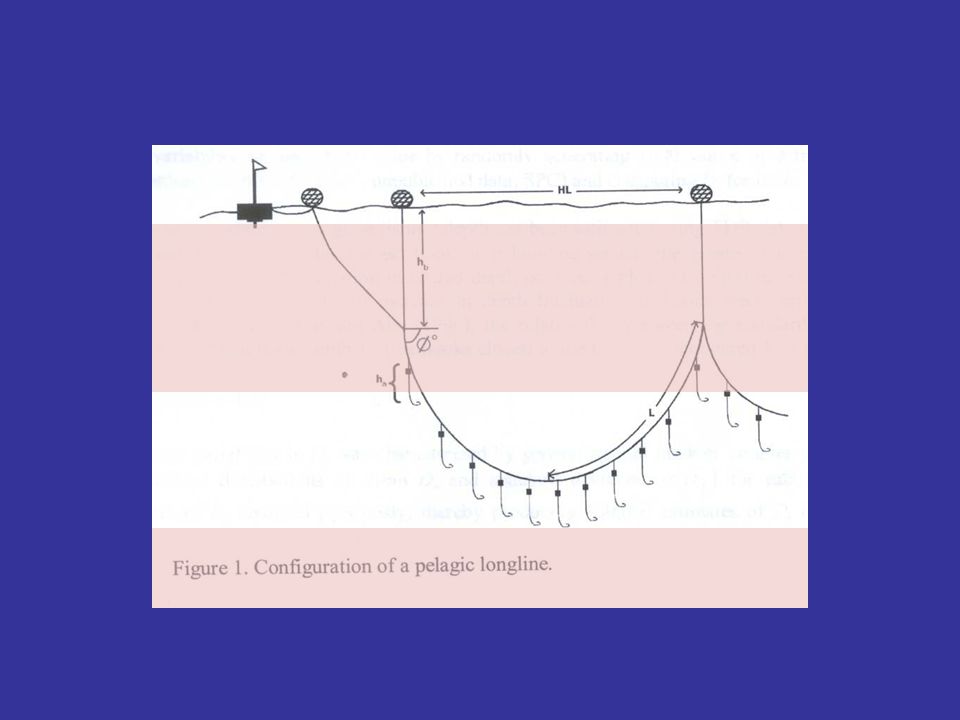
Habitat, gear, and fish behavior Fish have habitats that they prefer Habitat changes with the environment Fishermen’s behavior determines where the gear fishes Gear, habitat, and fish behavior have to match for fishing to be successful Gear, habitat, and fish behavior have to be taken into consideration when interpreting CPUE

30
Bigelow et al. 2000

33
Environment Thermocline

34
Depth of gear 50-150 50-400

35
Current

36
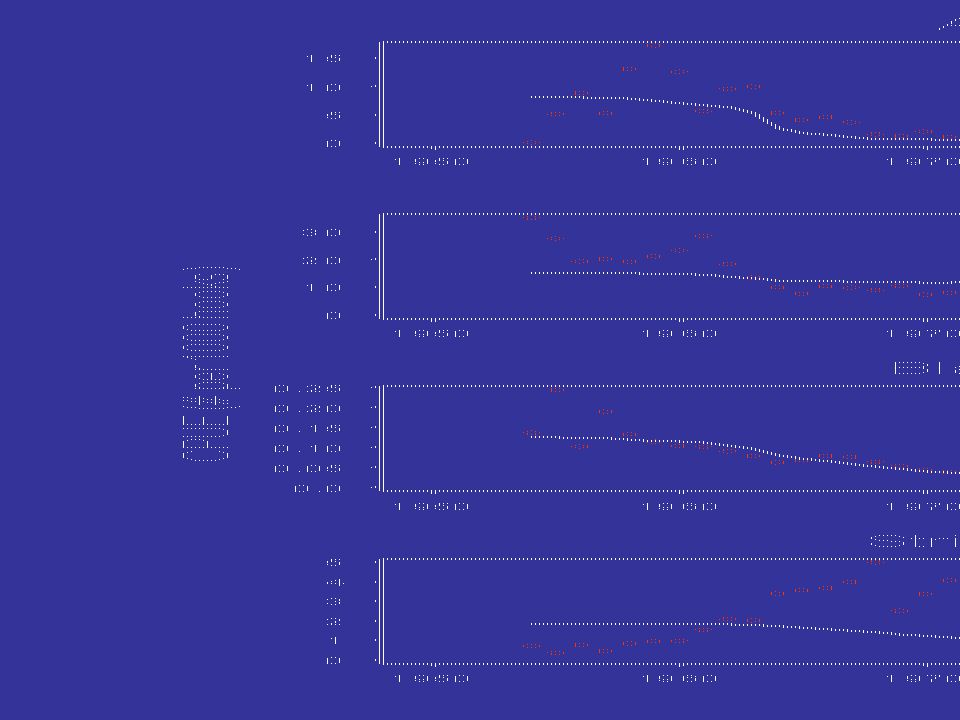
Increasing depth of longlines

37
EPO examples Bigeye tuna Yellowfin tuna From Keith Bigelow

38
Habitat standardization Used to remove the changes of gear depth and the environment from the relative index of abundance Method developed by Hinton and Nakano 1996 Applied to bigeye and yellowfin tuna by Bigelow et al. 2002 Used in the assessments of yellowfin tuna, bigeye tuna, blue marlin, striped marlin, and swordfish in the EPO

39
The “stupid” fish hypothesis

40
The stupid fish hypothesis under historic effort

41
CPUE vs abundance

42
The big “stupid” fish hypothesis (size-specific vulnerability)
")
43
Size-specific vulnerability

44
The size specific vulnerable hypothesis under historic effort

45
Blue marlin example

46
Historic yellowfin length frequency data 60 cm 150 cm Purse seineLongline Suda and Schaefer 1965 Size at 50% maturity

47
Other Hypotheses Multiple stocks (e.g. northern and southern albacore) Fraction of stock (bluefin) Stock distribution limited (e.g. Striped Marlin, Swordfish, sailfish, shortbill spearfish) Gear saturation/interference Increase in fishing power Targeting (swordfish, bait, setting at night) Age specific natural mortality Fishing regulations (e.g. EEZ)
 Fraction of stock (bluefin) Stock distribution limited (e.g. Striped Marlin, Swordfish, sailfish, shortbill spearfish) Gear saturation/interference Increase in fishing power Targeting (swordfish, bait, setting at night) Age specific natural mortality Fishing regulations (e.g. EEZ).")
48
Myers Dalhousie Group Soak time – increases current CPUE –Has slightly increased –Increased soak time increases CPUE Shark damage – increases current CPUE –25% in early data and about 4% in recent data –Lower shark damage increases CPUE Hook saturation - increases current CPUE –Bait loss due to catching other species has decreased –More bait available increases CPUE Depth of gear Ecosystem Also looking at non-pelagic species and dada from trawl World wide patterns similar

49
Summary –Regime change Same for all species? Implies that the stocks are depleted New management values for new regime –Ecosystem Implies that the stocks are depleted Does not explain all increase in production –Spatial distribution of effort Spatial expansion occurred when the rapid declines occurred CPUE declines faster than abundance Final depletion level is the same

50
Summary continued –Habitat and gear distribution Did not change during period of depletion Current abundance may be underestimated for most species explaining current catches –Stupid fish hypothesis Both stupid fish and age-specific vulnerability could explain some of the decline Indicates stocks are less depleted –Limited distribution of stock Probably explains increase in CPUE for striped marlin, swordfish, sailfish, and spearfish

51
Conclusions Regime change, ecosystem, and spatial distribution result in high depletion levels Longline depth, stupid fish hypothesis, and age-specific vulnerability result in lower depletion levels Ecosystem, spatial distribution, longline gear depth, and age-specific vulnerability most likely

53
Yellowfin and Bigeye selectivity Bigeye Yellowfin Age in quarters

54
60 cm 150 cm Size at 50% maturity Current yellowfin length frequency data 125 cm

55
Age-specific selectivity and recruitment residuals

Similar presentations


 Center for the Advancement of Population.>")

 Fish 458, Lecture 15.>")


