Download presentation
Presentation is loading. Please wait.

1
Student Growth Percentiles (SGPs) MDE - AdvancED Michigan 2014 Fall School Improvement Conference November 18, 2014
 MDE - AdvancED Michigan 2014 Fall School Improvement Conference November 18, 2014")
2
Student Growth Percentiles Student Growth Percentiles (SGPs) represent one powerful way to quantify the growth of individual students over time Conceptually, SGPs describe the variation of student’s growth (how much is greater or less than) compared to the growth of other students who had equivalent past test scores 2
 represent one powerful way to quantify the growth of individual students over time Conceptually, SGPs describe the variation of student’s growth (how much is greater or less than) compared to the growth of other students who had equivalent past test scores 2")
3
Student Growth Percentiles In order to calculate SGPs Students are grouped with other students throughout the state who had equivalent scores on the previous test Students are then ordered in their group based on their score on the current year test Each student then receives a percentile rank based on their order in the group 3

4
Student Growth Percentiles (SGPs) Basic questions What is a Student Growth Percentile? How would proposed SGPs be calculated? Why are SGPs helpful for parents and educators? Let’s try to understand SGPs by looking at two students who appear to be very similar, but in reality, are very different

5
Jane Took the most recent grade 4 mathematics test Received a scaled score of 434, which happened to be the state average, and Placed her in the “Proficient” performance level. But what is her progress? How much growth has she demonstrated?

6
John Also took the most recent grade 4 mathematics test Also received a scaled score of 434, which happened to be the state average, and he was also in the “Proficient” performance level. But what is his progress? How much growth has he demonstrated?

8
One way to better understand Jane’s growth would be to look at students who scored the same as Jane on last year’s mathematics test.

9
One way to better understand Jane’s growth would be to look at students who scored the same as Jane on last year’s mathematics test.

10
In reality, there are many students in Michigan who scored the same as Jane on last year’s 3 rd grade mathematics test, but let’s imagine that there were only 10.

11
301 Each of these students scored a 301 on last year’s 3 rd grade mathematics test and have now taken this year’s 4 th grade mathematics test as well.

12
375382376390395 408430 421432 448 Let’s order these students by their score on this year’s mathematics test.

13
All these students had the same 3 rd grade mathematics score (301). 375382376390395 408430 421 432 434 448 But each of them scored differently on the 4 th grade mathematics test.

14
375382376390395 408430 421432 434 448 A Student Growth Percentile (SGP) of 90 indicates that Jane scored better on the 4 th grade mathematics test than 90% of the students who started at the same point based on the previous test. All these students had the same 3 rd grade mathematics score (301).
..")
15
Let’s go through that same process for John by identifying the students in the state who scored the same as John on last year’s mathematics test.

16
Once again, in reality, there are many students in Michigan who scored the same as John on last year’s mathematics test, but let’s imagine that there were only 10.

17
Each of these students scored a 364 on last year’s 3 rd grade mathematics test and have now taken this year’s 4 th grade mathematics test as well. 364

18
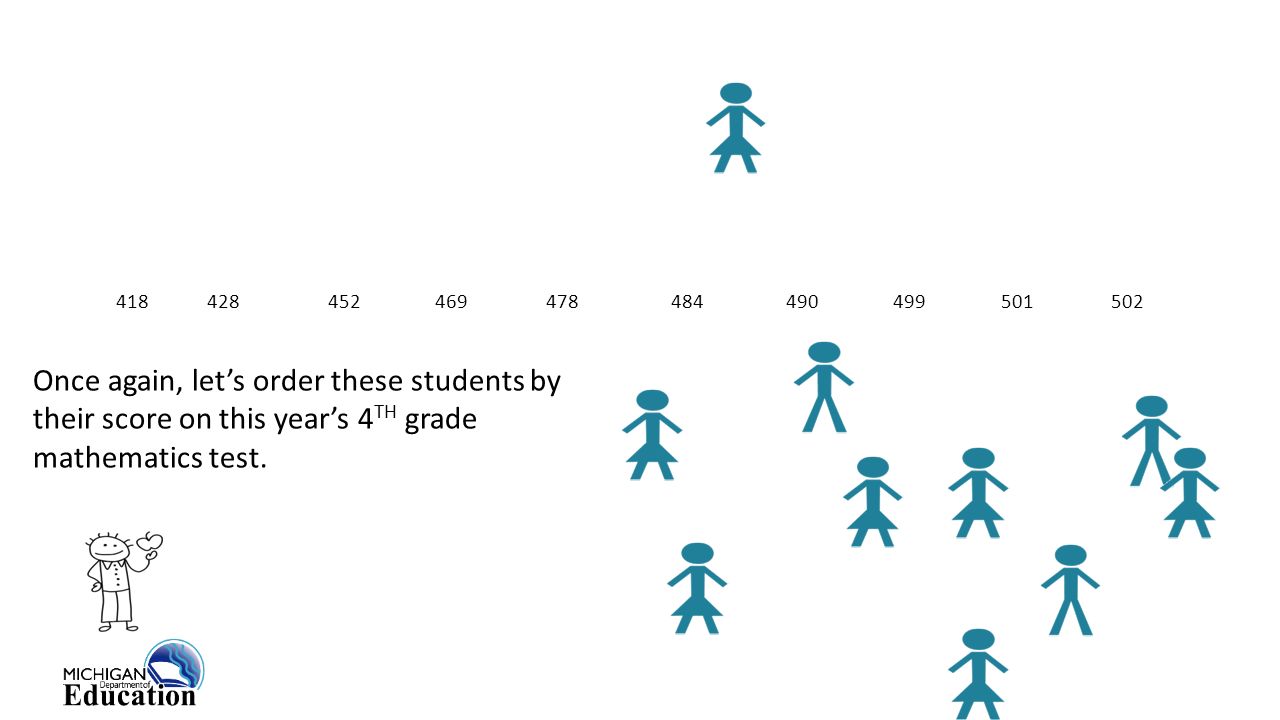
Once again, let’s order these students by their score on this year’s 4 TH grade mathematics test. 418452428469478 484499 490501 502
19
Last year’s mathematics score was 364 for all these students. 418452428469478 484499 490501 434 502 But each of them scored differently on the 4 th grade mathematics test.

20
Last year’s mathematics score was 364 for all these students 418452428469478 484499 490501 434 502 A Student Growth Percentile (SGP) of 20 indicates that John scored better on the 4 th grade mathematics test than only 20% of the students who started at the same point as he did on the previous test.
 of 20 indicates that John scored better on the 4 th grade mathematics test than only 20% of the students who started at the same point as he did on the previous test.")
21
Even though Jane and John received the same score on the 3 rd grade mathematics test, looking at their SGPs reveals that their growth is very different, and their academic progress in the last year varies significantly. Jane’s SGP of 90 shows her learning over time is greater than the majority of students who started at the same point as she did. John’s SGP of 20 tells a different story. John’s learning over time is less than other students who started at the same point as he did.

22
Student Growth Percentiles Student Growth Percentiles (SGPs) describe a student’s learning over time compared to other students with equivalent prior test scores An SGP of 50 shows average learning over time, with higher SGPs showing higher than average learning and lower SGPs showing lower than average learning SGPs are a very useful and powerful way to understand student learning over time
 describe a student’s learning over time compared to other students with equivalent prior test scores An SGP of 50 shows average learning over time, with higher SGPs showing higher than average learning and lower SGPs showing lower than average learning SGPs are a very useful and powerful way to understand student learning over time")
23
Summarizing SGPs using the Median Growth Percentile “An advantage of quantifying growth at the student level is that it is a simple task to combine the individual level growth results to quantify group performance [...] Because it is inappropriate to calculate the arithmetic average of a set of percentiles, the median is used as the single number that best describes where the middle of the distribution of student growth percentiles lies”
![Summarizing SGPs using the Median Growth Percentile An advantage of quantifying growth at the student level is that it is a simple task to combine the individual level growth results to quantify group performance [...] Because it is inappropriate to calculate the arithmetic average of a set of percentiles, the median is used as the single number that best describes where the middle of the distribution of student growth percentiles lies](http://images.slideplayer.com/29/9451518/slides/slide_23.jpg "Summarizing SGPs using the Median Growth Percentile An advantage of quantifying growth at the student level is that it is a simple task to combine the individual level growth results to quantify group performance [...] Because it is inappropriate to calculate the arithmetic average of a set of percentiles, the median is used as the single number that best describes where the middle of the distribution of student growth percentiles lies")
24
Median Growth Percentiles MGP is a metric that allows us to compare the growth of students who all begin with different ability levels To calculate the median, rank order all SGPs in a group and identify the SGP that falls at the middle (median) of the scores Like SGPs, MGPs can theoretically range from 0-99, but unlike SGPs, extreme high or low values are unlikely Based on Student Growth Percentiles (SGPs) calculated for Michigan students for the two most recent state testing cycles 24
 of the scores Like SGPs, MGPs can theoretically range from 0-99, but unlike SGPs, extreme high or low values are unlikely Based on Student Growth Percentiles (SGPs) calculated for Michigan students for the two most recent state testing cycles 24")
25
Strengths of using MGPs SGPs are more relevant to grade level context than other growth scores which assume that growth is equally likely at any ability level MGPs are well established models with a robust literature and implementation precedents in states across the nation SGPs and MGPs are relatively accessible to non-technical audiences 25

26
Strengths of using MGPs SGPs compare student growth to Michigan students with equivalent score histories MGPs are not based on slopes for high-school, and not vulnerable to cohort effects as other improvement metrics Unlike performance level change (PLC) indices, MGP can be easily/validly used across assessment transition years 26
 indices, MGP can be easily/validly used across assessment transition years 26")
27
Feedback and Questions 27

28
Contact Dan LaDue – ladued@michigan.govladued@michigan.gov Jared Robinson – robinsonj33@michigan.govrobinsonj33@michigan.gov Chris Janzer – janzerc@michigan.govjanzerc@michigan.gov MDE-accountability@michigan.gov MDE-accountability@michigan.gov 28

Similar presentations


![Enquiring mines wanna no.... Who is it? Coleman Report “[S]chools bring little influence to bear upon a child’s achievement that is independent of.](/15/4758624/big_thumb.jpg "Enquiring mines wanna no.... Who is it? Coleman Report “[S]chools bring little influence to bear upon a child’s achievement that is independent of.>")


 Model>")

267-1072>")


 Ranking 2014-2015.>")


