Download presentation
Presentation is loading. Please wait.

1
Pertemuan 3

2
INFORMATION NEEDS AND BUSINESS PROCESSES
Businesses engage in a variety of processes, including: Acquiring capital Buying buildings and equipment Hiring and training employees Purchasing inventory Doing advertising and marketing Selling goods or services Collecting payment from customers Paying employees Paying taxes Paying vendors Each activity requires different types of decisions.

3
INFORMATION NEEDS AND BUSINESS PROCESSES
Businesses engage in a variety of processes, including: Acquiring capital Buying buildings and equipment Hiring and training employees Purchasing inventory Doing advertising and marketing Selling goods or services Collecting payment from customers Paying employees Paying taxes Paying vendors Each decision requires different types of information.

4
INFORMATION NEEDS AND BUSINESS PROCESSES
Types of information needed for decisions: Some is financial Some is nonfinancial Some comes from internal sources Some comes from external sources An effective IS needs to be able to integrate information of different types and from different sources.

5
BUSINESS CYCLES A transaction is: EXAMPLES:
An agreement between two entities to exchange goods or services; OR Any other event that can be measured in economic terms by an organization. EXAMPLES: Sell goods to customers Depreciate equipment

6
BUSINESS CYCLES The business transaction cycle is a process that:
Begins with capturing data about a transaction. Ends with an information output, such as financial statements.

7
TRANSACTION PROCESSING: THE DATA PROCESSING CYCLE
The data processing cycle consists of four steps: Data input Data storage Data processing Information output

8
DATA INPUT The first step in data processing is to capture the data.
Usually triggered by a business activity. Data is captured about: The event that occurred. The resources affected by the event. The agents who participated.

9
DATA INPUT A number of actions can be taken to improve the accuracy and efficiency of data input: Turnaround documents. EXAMPLE: The stub on your telephone bill that you tear off and return with your check when you pay the bill. The customer account number is coded on the document, usually in machine-readable form, which reduces the probability of human error in applying the check to the correct account.

10
DATA INPUT A number of actions can be taken to improve the accuracy and efficiency of data input: Turnaround documents. Source data automation. Capture data with minimal human intervention. EXAMPLES: ATMs for banking. Point-of-sale (POS) scanners in retail stores. Automated gas pumps that accept your credit card.
 scanners in retail stores. Automated gas pumps that accept your credit card.")
11
DATA INPUT A number of actions can be taken to improve the accuracy and efficiency of data input: Turnaround documents. Source data automation. Well-designed source documents and data entry screens. How do these improve the accuracy and efficiency of data input?

12
DATA INPUT A number of actions can be taken to improve the accuracy and efficiency of data input: Turnaround documents. Source data automation. Well-designed source documents and data entry screens. Using pre-numbered documents or having the system automatically assign sequential numbers to transactions. What does it mean if a document number is missing in the sequence?

13
DATA INPUT A number of actions can be taken to improve the accuracy and efficiency of data input: Turnaround documents. Source data automation. Well-designed source documents and data entry screens. Using pre-numbered documents or having the system automatically assign sequential numbers to transactions. What does it mean if there are duplicate document numbers?

14
DATA INPUT A number of actions can be taken to improve the accuracy and efficiency of data input: Turnaround documents. Source data automation. Well-designed source documents and data entry screens. Using pre-numbered documents or having the system automatically assign sequential numbers to transactions. Verify transactions. EXAMPLE: Check for inventory availability before completing an online sales transaction.

15
DATA STORAGE Data needs to be organized for easy and efficient access.
Example: journal, ledger

16
DATA PROCESSING Once data about a business activity has been collected and entered into a system, it must be processed.

17
INFORMATION OUTPUT The final step in the information process is information output. This output can be in the form of: Documents Documents are records of transactions or other company data. EXAMPLE: Employee paychecks or purchase orders for merchandise. Documents generated at the end of the transaction processing activities are known as operational documents (as opposed to source documents). They can be printed or stored as electronic images.
. They can be printed or stored as electronic images.")
18
INFORMATION OUTPUT The final step in the information process is information output. This output can be in the form of: Documents Reports Reports are used by employees to control operational activities and by managers to make decisions and design strategies. They may be produced: On a regular basis On an exception basis On demand Organizations should periodically reassess whether each report is needed.

19
INFORMATION OUTPUT The final step in the information process is information output. This output can be in the form of: Documents Reports Queries Queries are user requests for specific pieces of information. They may be requested: Periodically One time They can be displayed: On the monitor, called soft copy. On the screen, called hard copy.

20
INFORMATION OUTPUT Output can serve a variety of purposes:
Financial statements can be provided to both external and internal parties. Some outputs are specifically for internal use: For planning purposes Examples of outputs for planning purposes include: Budgets Budgets are an entity’s formal expression of goals in financial terms. Sales forecasts

21
INFORMATION OUTPUT Output can serve a variety of purposes:
Financial statements can be provided to both external and internal parties. Some outputs are specifically for internal use: For planning purposes For management of day-to-day operations Example: Delivery schedules

22
INFORMATION OUTPUT Output can serve a variety of purposes:
Performance reports are outputs that are used for control purposes. These reports compare an organization’s standard or expected performance with its actual outcomes. Management by exception is an approach to utilizing performance reports that focuses on investigating and acting on only those variances that are significant. Output can serve a variety of purposes: Financial statements can be provided to both external and internal parties. Some outputs are specifically for internal use: For planning purposes For management of day-to-day operations For control purposes

23
INFORMATION OUTPUT Output can serve a variety of purposes:
Financial statements can be provided to both external and internal parties. Some outputs are specifically for internal use: For planning purposes For management of day-to-day operations For control purposes For evaluation purposes These outputs might include: Surveys of customer satisfaction. Reports on employee error rates.

24
Documentation Documentation includes the following types of tools:
Narratives (written descriptions) Flowcharts Diagrams Other written material
 Flowcharts. Diagrams. Other written material.")
25
Documentation In this chapter, we discuss two of the most common documentation tools: Data flow diagrams Graphical descriptions of the sources and destinations of data. They show: Where data comes from How it flows The processes performed on it Where it goes

26
Documentation In this chapter, we discuss two of the most common documentation tools: Data flow diagrams Flowcharts Include three types: Document flowcharts describe the flow of documents and information between departments or units. System flowcharts describe the relationship between inputs, processing, and outputs for a system. Program flowcharts describe the sequence of logical operations performed in a computer program.

27
Documentation Documentation tools support organization in:
Organizing very complicated systems into a form that can be more readily understood. Helping new team members understand a pre-existing system.

28
INTRODUCTION TO DFD AND FLOWCHART
Which method should you use—flowcharts or DVDs? 62.5% of IS professionals use DFDs 97.6% use flowcharts

29
DATA FLOW DIAGRAMS A data flow diagram (DFD) graphically describes the flow of data within an organization. It is used to: Document existing systems Plan and design new systems There is no black-and-white approach to developing a DFD.

30
DFD Symbol Menggambarkan agent/subyek
Menggambarkan proses yang terjadi Menggambarkan alur Menggambarkan data/informasi

31
DATA FLOW DIAGRAMS Example of a data flow diagram of the customer payment process from Figure 3-3 in your textbook. Accounts Receivable Customer payment 1.0 Process Payment 2.0 Update A/R Customer Remittance data Receivables Information Credit Manager Deposit Bank

32
FLOWCHARTS A flowchart is an analytical technique that describes some aspect of an information system in a clear, concise, and logical manner. Flowcharts use a set of standard symbols to depict processing procedures and the flow of data. Flowcharting History: Introduced in 1950s by industrial engineers to document business processes and document flows for process improvement. Sarbanes-Oxley 2002 increased importance by requiring companies to document business processes and internal controls procedures.

33
FLOWCHARTS Every shape on a flowchart depicts a unique operation, input, processing activity, or storage medium. In the days of yore, flowcharts were manually created using plastic templates. Most flowcharts are now drawn using a software program such as Visio. Microsoft and Power Point are also used. The software uses pre-drawn shapes, and the developer drags the shapes into the drawing.

34
FLOWCHARTS There are four types of flowcharting symbols:
Input/output symbols Input/output symbols indicate the type of device or media that provides input to or records output from a process.

35
FLOWCHARTS There are four types of flowcharting symbols:
Input/output symbols Processing symbols Processing symbols indicate the type of device used to process the data or whether the data is processed manually.

36
FLOWCHARTS There are four types of flowcharting symbols:
Input/output symbols Processing symbols Storage symbols Storage symbols indicate the type of device used to store data while the system is not using it.

37
FLOWCHARTS There are four types of flowcharting symbols:
Input/output symbols Processing symbols Storage symbols Flow and miscellaneous symbols Flow and miscellaneous symbols may indicate: The flow of data and goods The beginning or end of the flowchart The location of a decision An explanatory note

38
FLOWCHARTS Click on buttons below if you wish to review symbols in the various categories. Input/Output Symbols Processing Symbols Storage Symbols Flow & Misc. Symbols

39
INPUT/OUTPUT SYMBOLS Document Symbol
Represents a document or report that is prepared by hand or printed by a computer.

40
INPUT/OUTPUT SYMBOLS Multiple Copies of One Document
2 3 1 Multiple Copies of One Document Indicates multiple copies of a paper document or report. The document copies should be numbered in the upper, right-hand corner.

41
INPUT/OUTPUT SYMBOLS Input/Output; Journal/Ledger
Can represent any input or output on a program flowchart. Also represents accounting journals or ledgers in a document flowchart.

42
INPUT/OUTPUT SYMBOLS Display
Represents information displayed by an online output device such as a terminal, monitor, or screen.

43
INPUT/OUTPUT SYMBOLS Online Keying
Represents data entry by an online device such as a terminal or personal computer.

44
INPUT/OUTPUT SYMBOLS Terminal or Personal Computer
Combines the display and online keying symbols to represent terminals and personal computers.

45
INPUT/OUTPUT SYMBOLS Transmittal Tape
Represents manually prepared control totals, which are to be compared to computer totals for control purposes. Return to Menu Processing Symbols Skip Symbols

46
PROCESSING SYMBOLS Computer Processing
Represents a process performed by a computer, which usually results in a change in data or information.

47
PROCESSING SYMBOLS Manual Operation
Represents a processing operation that is performed manually.

48
PROCESSING SYMBOLS Auxiliary Operation
Represents a processing operation carried out by a device other than a computer, e.g., an optical character scanner.

49
PROCESSING SYMBOLS Off-line Keying Operation
Represents an operation that uses an off-line keying device, such as a cash register or keying to a disk. Return to Menu Storage Symbols Skip Symbols

50
STORAGE SYMBOLS Magnetic Disk/Drive
Represents data stored on a magnetic disk or drive.

51
STORAGE SYMBOLS Magnetic Tape
Represents data stored on a magnetic tape. Sometimes represents transaction files.

52
STORAGE SYMBOLS A File Represents a file of documents that are manually stored and retrieved. Letter indicates the ordering sequence: A = Alphabetic order D = Date order N = Numeric order Return to Menu Flow/Misc. Symbols Skip Symbols

53
FLOW AND MISCELLANEOUS SYMBOLS
Document or Processing Flow Represents the direction of processing or document flow. Normal flow is top to bottom and left to right.

54
FLOW AND MISCELLANEOUS SYMBOLS
Data/Information Flow Represents the direction of data/information flow. Often used to show data being copied from one document to another.

55
FLOW AND MISCELLANEOUS SYMBOLS
Communication Link Represents the transmission of data from one location to another via communication lines.

56
FLOW AND MISCELLANEOUS SYMBOLS
On-page connector Connects processing from one location to another on the same page. Used to avoid crisscrossing lines.

57
FLOW AND MISCELLANEOUS SYMBOLS
Off-page Connector Connects the processing flow between two different pages. Signals the exit from one page and the corresponding entrance on another page.

58
FLOW AND MISCELLANEOUS SYMBOLS
Terminal Represents the beginning, end, or a point of interruption in a process or program. Also used to indicate an external party.

59
FLOW AND MISCELLANEOUS SYMBOLS
Decision Represents a decision-making step. Used in a program flowchart to show branching to alternate paths.

60
FLOW AND MISCELLANEOUS SYMBOLS
Annotation Provides for the addition of descriptive comments or explanatory notes as clarification. Return to Menu Continue

61
Continue Next Week…..

62
DOCUMENT FLOWCHARTS A document flowchart shows the flow of documents and information among areas of responsibility in an organization. These flowcharts trace a document from cradle to grave and show: Where a document comes from Where it’s distributed How it’s used It’s ultimate disposition Everything that happens as it flows through the system

63
DOCUMENT FLOWCHARTS Internal control flowcharts are document flowcharts used to evaluate the adequacy of internal controls, such as segregation of duties or internal checks. They can reveal weaknesses or inefficiencies such as: Inadequate communication flows Unnecessarily complex document flows Procedures that cause wasteful delays Document flowcharts are also prepared in the system design process.

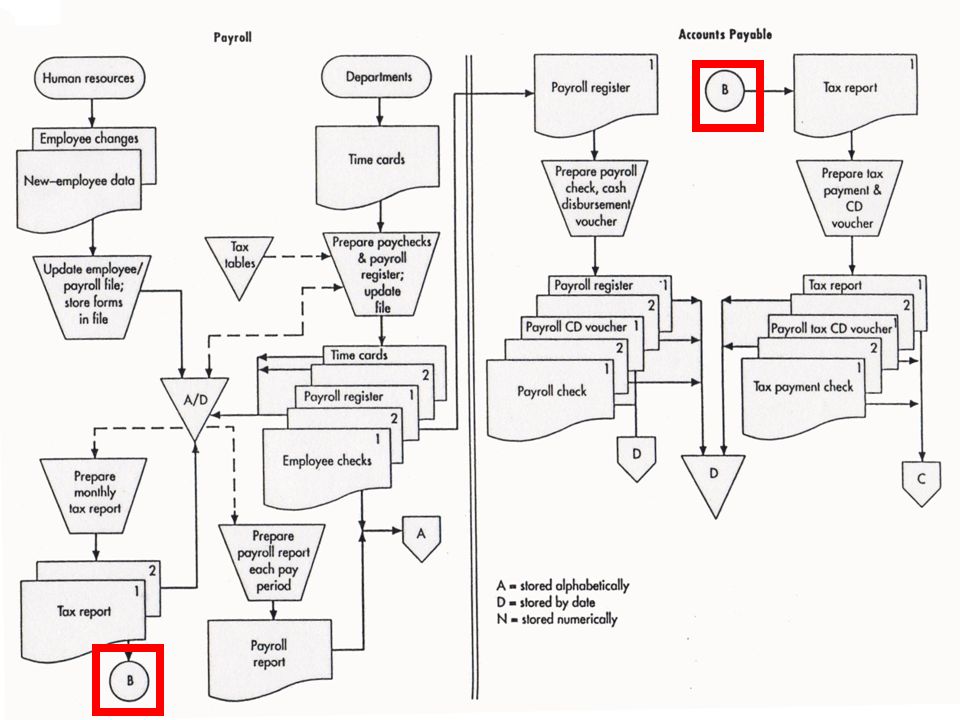
64
This is part of the document flowchart from Figure 3-9 in your textbook.

65
GUIDELINES FOR PREPARING FLOWCHARTS
Let’s step through some guidelines for preparing flowcharts: As with DFDs, you can’t effectively prepare a flowchart if you don’t understand the system, so: Interview users, developers, auditors, and management Administer questionnaires Read through narratives Walk through systems transactions

66
GUIDELINES FOR PREPARING FLOWCHARTS
Identify: Entities to be flowcharted, e.g., departments, functions, external parties (the parties who “do” things in the story) Documents or information flows Processes As you read through a narrative, you may want to mark the preceding items with different shapes (e.g., drawing a rectangle around entities, circling documents, etc.).
 Documents or information flows. Processes. As you read through a narrative, you may want to mark the preceding items with different shapes (e.g., drawing a rectangle around entities, circling documents, etc.).")
67
GUIDELINES FOR PREPARING FLOWCHARTS
Use separate columns for the activity of each entity. Example: If there are three different departments or functions that “do” things in the narrative, there would be three columns on the flowchart.

68
What are the entities in this flowchart?

69
GUIDELINES FOR PREPARING FLOWCHARTS
Flowchart the normal course of operations, and identify exceptions with annotations. As much as possible, the flow should go from top to bottom and left to right. Use standard flowcharting symbols, and draw with a template or computer. Clearly label all symbols. Use annotations if necessary to provide adequate explanation.

70
GUIDELINES FOR PREPARING FLOWCHARTS
Give the flowchart a clear beginning and ending. Show where each document originated and its final disposition. One approach you can use is to read through the narrative and for each step define: What was (were) the input(s) What process was carried out What was (were) the output(s) Note on the next slide that the flow sequence is input—process—output.
 the input(s) What process was carried out. What was (were) the output(s) Note on the next slide that the flow sequence is input—process—output.")
71
Identifies where input is coming from

72
Inputs

73
Process

74
Output to storage

75
Input for next process

76
Process

77
Output

78
GUIDELINES FOR PREPARING FLOWCHARTS
Every manual process should have at least one input and at least one output. Show all data entered into or retrieved from a computer file as passing through a process first. Do not show process symbols for: Forwarding a document to another entity Filing a document

79
Forwarding a document

80
Filing a document

81
GUIDELINES FOR PREPARING FLOWCHARTS
Do not connect two documents except when forwarding to another column. When a document is forwarded, show it in both locations.

82
Show forwarded document in both locations

83
GUIDELINES FOR PREPARING FLOWCHARTS
When using multiple copies of a document, place document numbers in the upper, right-hand corner.

84
What happens to the document numbers as the documents move to other locations?

85
GUIDELINES FOR PREPARING FLOWCHARTS
Show on-page connectors and label them clearly to avoid excess flow lines.

87
GUIDELINES FOR PREPARING FLOWCHARTS
Use off-page connectors if the flow goes to another page.

88
Are there other off-page connectors on this flowchart?

89
GUIDELINES FOR PREPARING FLOWCHARTS
If a flowchart takes more than one page, label the pages as 1 of 5, 2 of 5, 3 of 5, etc. Show documents or reports first in the column where they are created. Start with a rough draft; then redesign to avoid clutter and crossed lines. Verify the accuracy of your flowchart by reviewing it with users, etc. Place the flowchart name, the date, and the preparer’s name on each page of the final copy.

90
SYSTEM FLOWCHARTS Now that we’ve looked at document flowcharts and guidelines for creating flowcharts, let’s take a brief look at system flowcharts.

91
SYSTEM FLOWCHARTS A system flowchart depicts the relationship among the inputs, processes, and outputs of an AIS. The system flowchart begins by identifying the inputs to the system. These inputs can be: New data Data stored for future use Both

92
SYSTEM FLOWCHARTS A system flowchart depicts the relationship among the inputs, processes, and outputs of an AIS. The system flowchart begins by identifying the inputs to the system. Each input is followed by a process, i.e., the steps performed on the data. If the process is performed by a computer, the logic of the computer program would be depicted in a program flowchart.

93
SYSTEM FLOWCHARTS A system flowchart depicts the relationship among the inputs, processes, and outputs of an AIS. The system flowchart begins by identifying the inputs to the system. Each input is followed by a process, i.e., the steps performed on the data. The process is followed by outputs—the resulting new information. The output may be: Stored for later use Displayed on a screen Printed on paper An input to the next process

94
SYSTEM FLOWCHARTS A system flowchart depicts the relationship among the inputs, processes, and outputs of an AIS. The system flowchart begins by identifying the inputs to the system. Each input is followed by a process, i.e., the steps performed on the data. The process is followed by outputs—the resulting new information. In other words, it’s the same basic input— process—output pattern that we saw in the document flowchart.

95
PROGRAM FLOWCHARTS Program flowcharts illustrate the sequence of logical operations performed by a computer in executing a program. They also follow an input—process— output pattern.

96
Note that the program flowchart details the logic of processes performed by the computer.

97
This flowchart becomes the programmer’s blueprint for writing the actual computer program.

Similar presentations