Download presentation
Presentation is loading. Please wait.

1
Edpsy 511 Basic concepts Exploratory Data Analysis

2
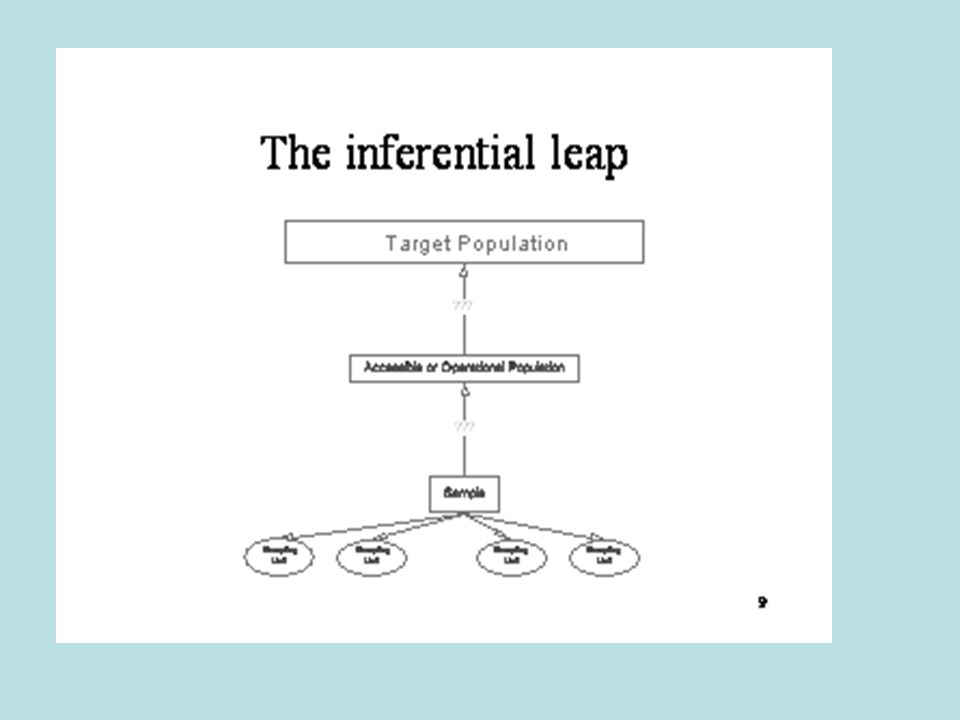
Populations vs. Samples Population –The complete set of individuals Characteristics are called parameters Sample –A subset of the population Characteristics are called statistics. –In most cases we cannot study all the members of a population

4
Descriptive vs. Inferential Descriptive statistics –Summarize/organize a group of numbers from a research study Inferential statistics –Draw conclusions/make inferences that go beyond the numbers from a research study –Determine if a causal relationship exists between the IV and DV

5
Random Sampling vs. Random Assignment Simple random sampling –Each member of the population has an equal likelihood of being selected. Helps ensure that our sample will represent the population of interest. Random assignment –Assigning subjects to different conditions in a way that they have equal chance of being placed in either condition. Controls for confounding

6
Goals of Scientific Research Exploratory –What is out there? Descriptive –What does this group look like? Explanatory –Why and how are these constructs related? Evaluation –Does this program work? Prediction –Who will become depressed?

7
Common Research Designs Correlational –Do two qualities “go together”. Comparing intact groups –a.k.a. causal-comparative and ex post facto designs. Quasi-experiments –Researcher manipulates IV True experiments –Must have random assignment. Why? –Researcher manipulates IV

8
Measurement Is the assignment of numerals to objects. –Nominal Examples: Gender, party affiliation, and place of birth Ordinal –Examples: SES, Student rank, and Place in race Interval –Examples: Test scores, personality and attitude scales. Ratio –Examples: Weight, length, reaction time, and number of responses

9
Categorical, Continuous and Discontinuous Categorical (nominal) –Gender, party affiliation, etc. Discontinuous –No intermediate values Children, deaths, accidents, etc. Continuous –Variable may assume an value Age, weight, blood sugar, etc.

10
Values Exhaustive –Must be able to assign a value to all objects. Mutually Exclusive –Each object can only be assigned one of a set of values. A variable with only one value is not a variable. –It is a constant.

11
Statistical Notation Nouns, Adjectives, Verbs and Adverbs. –Say what? Here’s what you need to know –X X i = a specific observation –N # of observations –∑ Sigma –Means to sum –Work from left to right Perform operations in parentheses first Exponentiation and square roots Perform summing operations Simplify numerator and divisor Multiplication and division Addition and subtraction

12
Pop Quiz (non graded) –In groups of three or four Perform the indicated operations. What was that?
 –In groups of three or four Perform the indicated operations. What was that")
13
Exploratory Data Analysis A set of tools to help us exam data –Visually representing data makes it easy to see patterns. 49, 10, 8, 26, 16, 18, 47, 41, 45, 36, 12, 42, 46, 6, 4, 23, 2, 43, 35, 32 –Can you see a pattern in the above data? Imagine if the data set was larger. –100 cases –1000 cases

14
Three goals Central tendency –What is the most common score? –What number best represents the data? Dispersion –What is the spread of the scores? What is the shape of the distribution?

15
Frequency Tables Let say a teacher gives her students a spelling test and wants to understand the distribution of the resultant scores. –5, 4, 6, 3, 5, 7, 2, 4, 3, 4 ValueFCumulative F%Cum% 71110% 612 20% 524 40% 43730%70% 32920%90% 211010%100% N=10

16
As groups Create a frequency table using the following values. –20, 19, 17, 16, 15, 14, 12, 11, 10, 9

17
Banded Intervals A.k.a. Grouped frequency tables With the previous data the frequency table did not help. –Why? Solution: Create intervals Try building a table using the following intervals <=13, 14 – 18, 19+

18
Stem-and-leaf plots Babe Ruth –Hit the following number of Home Runs from 1920 – 1934. 54, 59, 35, 41, 46, 25, 47, 60, 54, 46, 49, 46, 41, 34, 22 –As a group let’ build a stem and leaf plot –With two classes’ spelling scores on a 50 item test. Class 1: 49, 46, 42, 38, 34, 33, 32, 30, 29, 25 Class 2: 39, 38, 38, 36, 36, 31, 29, 29, 28, 19 –As a group let’ build a stem and leaf plot

19
Landmarks in the data Quartiles –We’re often interested in the 25 th, 50 th and 75 th percentiles. 39, 38, 38, 36, 36, 31, 29, 29, 28, 19 –Steps First, order the scores from least to greatest. Second, Add 1 to the sample size. –Why? Third, Multiply sample size by percentile to find location. –Q1 = (10 + 1) *.25 –Q2 = (10 + 1) *.50 –Q3 = (10 + 1) *.75 »If the value obtained is a fraction take the average of the two adjacent X values.
 *.25 –Q2 = (10 + 1) *.50 –Q3 = (10 + 1) *.75 »If the value obtained is a fraction take the average of the two adjacent X values..")
20
Box-and-Whiskers Plots (a.k.a., Boxplots)
")
21
Shapes of Distributions Normal distribution Positive Skew –Or right skewed Negative Skew –Or left skewed

22
How is this variable distributed?

25
A little on SPSS The assignments require hand calculations and SPSS practice –Typically I have you check your answers using SPSS –Do not buy SPSS –Do not leave the SPSS work for night before the due date. –You will need a TEC center account Do that after class today

Similar presentations