Download presentation
Presentation is loading. Please wait.

2
Take a deep breath! Please read the board. Please find your notes from yesterday

5
Breathing! Some basics

6
What is in our atmosphere? Normal chemical composition of our atmosphere: (N 2 ) 78% (O 2 ) 21% Trace gases (water, argon, carbon dioxide, other pollutants) 1%
 78% (O 2 ) 21% Trace gases (water, argon, carbon dioxide, other pollutants) 1%.")
9
Measuring pollutants parts per thousand = ppt parts per million = ppm Parts per billion = ppb

10
Clean Air Act Passed by Congress in 1970, updated in 1990. Required EPA to identify criteria pollutants and to establish minimum standards: EPA came up with NAAQ’s

11
National Ambient Air Quality Standards Six criterion pollutants: NO x, SO x, O 3, Pb, CO, particulates Established minimum standards: 1hr and 8 hr EPA is working to have greenhouse gases added by Congress to the NAAQs

12
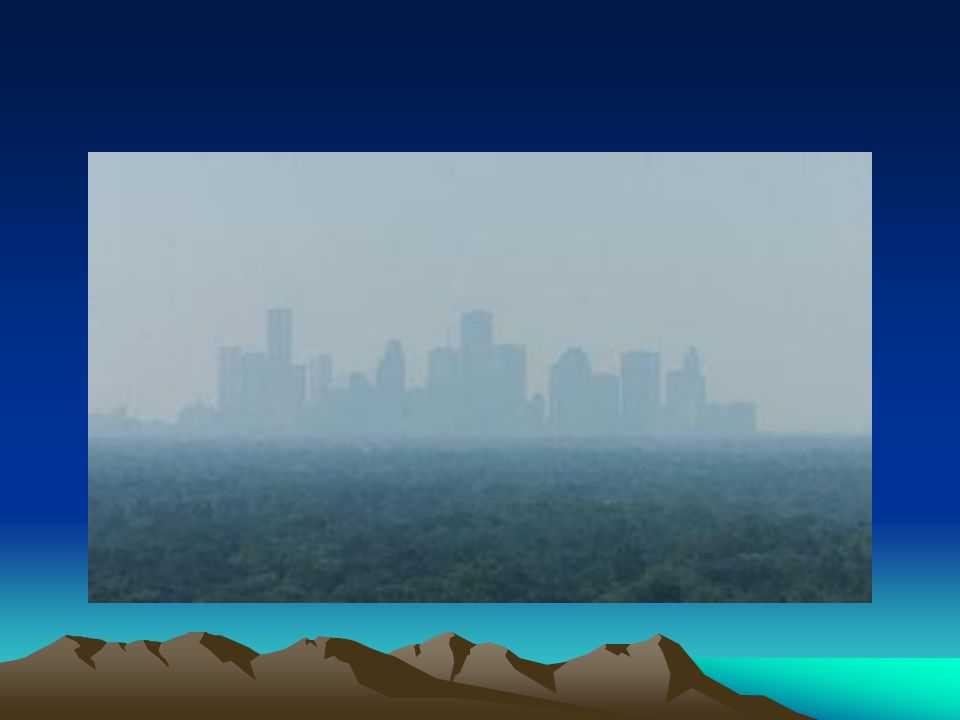
Ground level ozone in H- town

13
Smog and ozone form together 1.N 2 + O 2 2NO 2.2NO + O 2 2NO 2 3.NO 2 + UV radiation NO + O 4.O + O 2 O 3

14
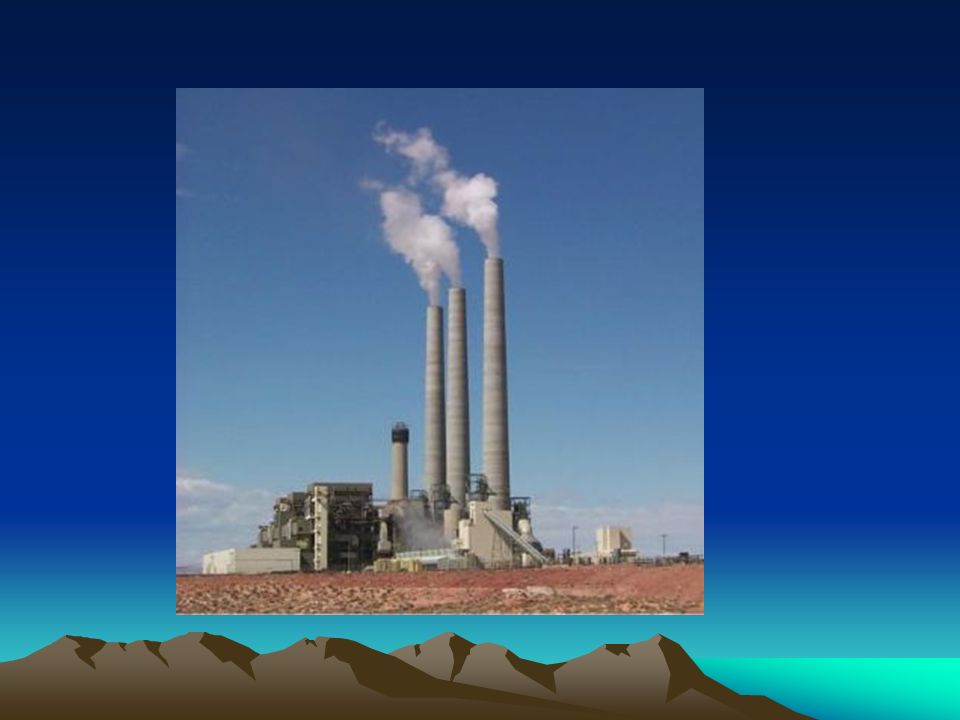
Primary pollutants Come directly from source Step one: N 2 + O 2 2NO

17
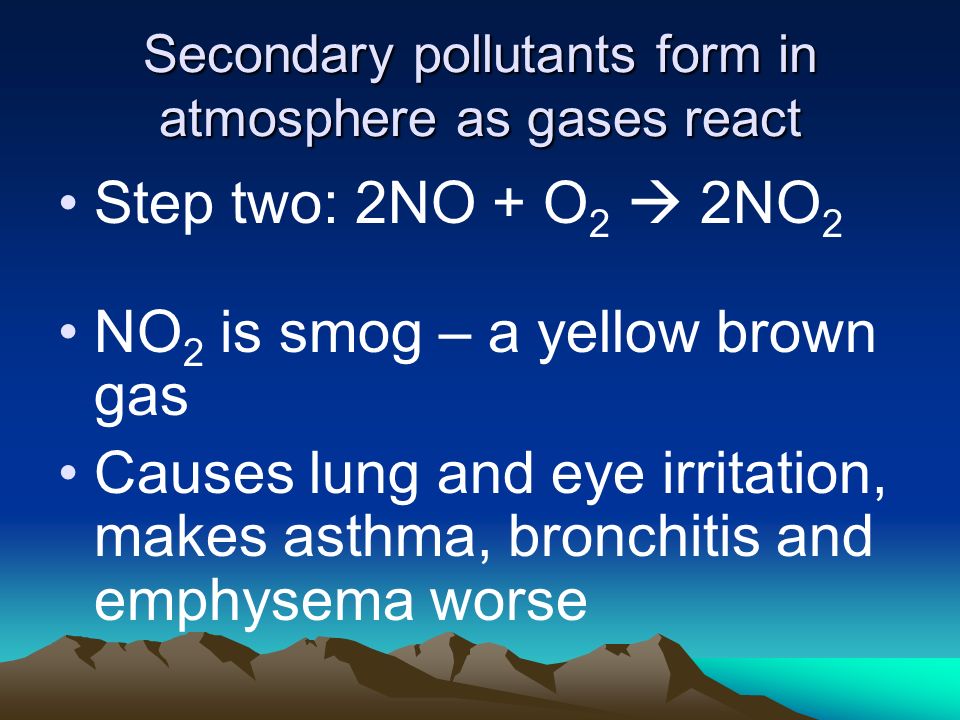
Secondary pollutants form in atmosphere as gases react Step two: 2NO + O 2 2NO 2 NO 2 is smog – a yellow brown gas Causes lung and eye irritation, makes asthma, bronchitis and emphysema worse

19
Ozone formation Step 3: NO 2 + UV radiation NO + O Step 4:O + O 2 O 3 Ozone slows photosynthesis, eye and lung irritant, makes asthma, emphysema, bronchitis worse

20
Fill in your first flip chart page! Brown pencils please!

21
VOCs – a second route for O 3 formation Volatile Organic Compounds: –Methane (CH 4 ) –Propane –Chlorofluorocarbons (CFC)
 –Propane –Chlorofluorocarbons (CFC)")
22
–VOCs can break O 2 into free oxygen atoms (free radicals) –VOC + O 2 VOC + 2O –O + O 2 O 3
 –VOC + O 2 VOC + 2O –O + O 2 O 3")
23
Check out ozone formation Texas Commission on Environmental Quality –EPA: National/Federal Regulatory agency –TCEQ: state regulatory agency ozone animation Houston Clean Air Network Map

24
AQI: set at 100 for each criterion pollutant level. Ozone 100 AQI = 85ppb

25
Smog and ozone form together 1.N 2 + O 2 2NO 2.2NO + O 2 2NO 2 3.NO 2 + UV radiation NO + O 4.O + O 2 O 3 Ozone season: March- November Ozone daily formation: noon-early evening

26
We're #? We're #?....for the number of days exceeding allowable ground level ozone levels. American Lung Association State of the AirAmerican Lung Association State of the Air

27
Year High ozone days 1 hr average/ highest recorded High ozone days 8 hr average 20128 days/143 ppb35 days/121ppb 20107 days/149 ppb44 days/97ppb 20096 days/ 157ppb 28 days/ 110ppb 20086days/143ppb31days/106 ppb 20079 days / 166 ppb46 days / 112 ppb 200620 days/165ppb62 days/126 ppb Observations/Inferences

28
So what is being done about this? - City monitoring

29
45 mobile monitoring stations

30
State monitoring Flexible permitting – each facility has total cap emissions limit, but flexibility in how they meet that limit. TCEQ issues permits for emitting certain amount of pollutants Facilities do “self reporting”

31
Check your understanding! Why are we more likely to hit an orange AQI at 3pm in August than at 8am in December? Why is it important that Houston improve its air quality?

Similar presentations


 Particulate Matter 2.5 (PM 2.5 ) The Challenge: Air Pollution.>")


