Download presentation
Presentation is loading. Please wait.

1
Evaluation Measures for Municipal Storm Water Management Programs Daniel Rourke Fresno Metropolitan Flood Control District October 15, 2003 Counting Raindrops

4
What is my job? To eliminate and reduce pollutant discharges going to storm drains.

5
Fresno Metropolitan Flood Control District When it rains or when an area is hosed down, chemicals and eroded sediment enter the storm drain inlet …… How Does Pollution Occur?

6
…..the chemicals enter the storm drain inlet, travel through a pipe…

7
…and enter one of the local ponding basins designed to recharge the groundwater aquifer…

8
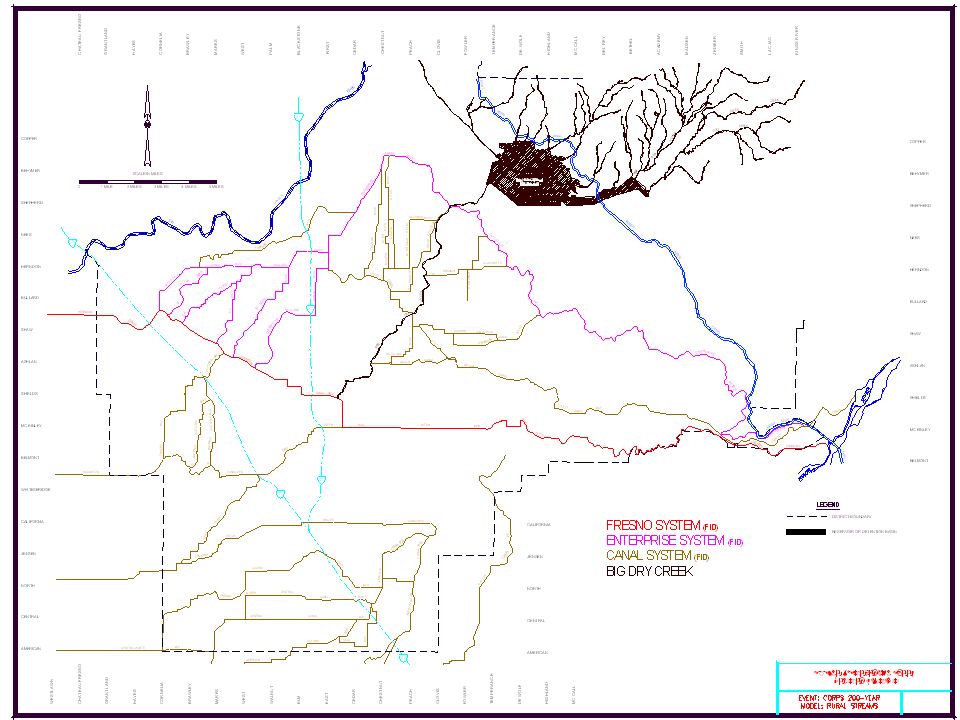
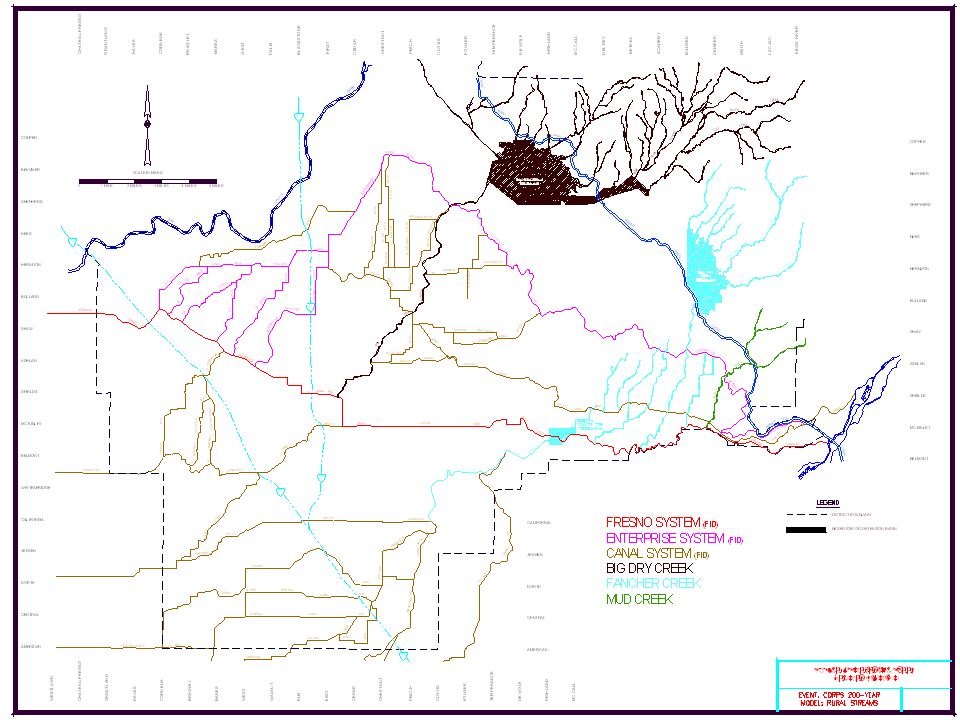
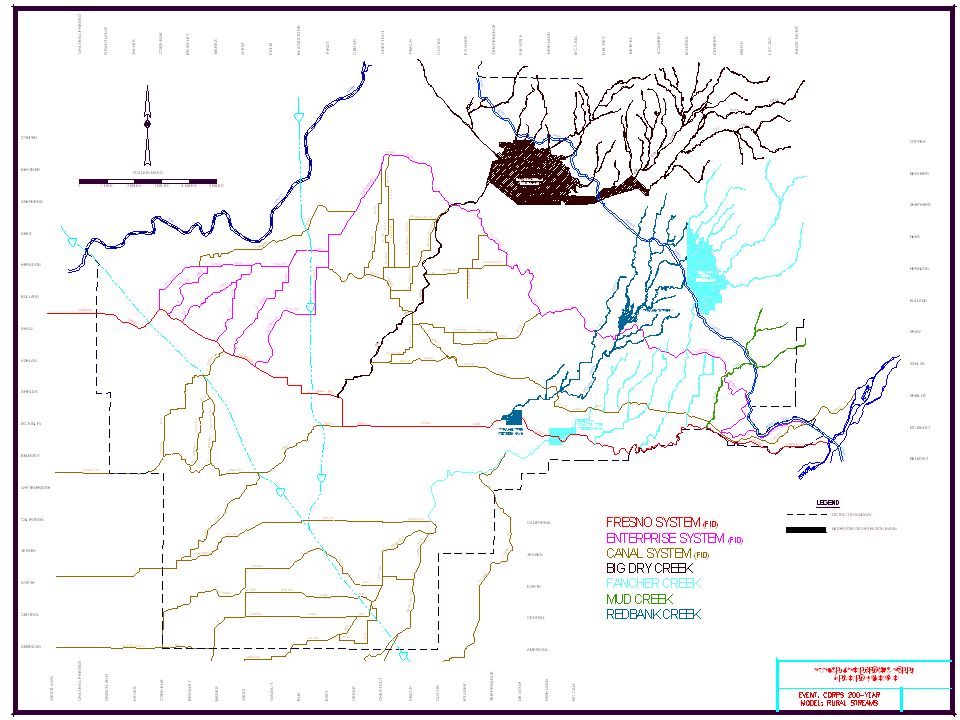
…or the pollutants travel to detention basins which discharge into local waterways such as the San Joaquin River.

9
Pollutants entering basins and local waterways can impact the quality of groundwater – your drinking water

10
Polluted water can also impact livestock and aquatic life…

11
Pollution can impact recreation…

12
Water Resources Goal To reduce the amount of sediment that ends up in our local basins, where it can clog the systems and prevent infiltration to groundwater.

13
…and excess sediments in storm drains can lead to flooding issues and increased fees for maintenance

25
Duel use pounding basin and neighborhood park

26
Dual use retention/recharge basin

27
On average, 27,000 acre feet is transferred from FID into flood control basins and infiltrated back into the ground water each year 8.8 billion gallons 74,000 Fresno residents for one year

28
Storm Water flows to Storm Water flows to: 5 % 25% 70% 17,000 acre feet per year = 5.5 billion gallons = 46,000 Fresno Residents

30
Water Main Installation and Flushing

32
Stages to Environmental Improvement Design and implement program Increase awareness of pollution issues Change behavior Reduce inputs of targeted pollutants Improve water quality of discharges Improve environmental condition

33
Process Framework Identify the issue Identify and assess sources Determine available control strategies Evaluate and prioritize control strategies Establish a goal Implement the program Evaluate effectiveness Modify program

34
Program Implementation Effectiveness Measurements Project planning –Audience characterization –Baseline information –Existing program review Implementation –Tracking progress –Achieving milestones –Meeting expectations Completion –Goals achieved –Most successful strategies –Future needs/ next steps

35
Impact Effectiveness Measurement Tools Measuring increased awareness –Phone surveys –Mailed surveys –Intercept surveys –Water Quality Monitoring Measuring behavior change –Sales Tracking –Participation Tracking –Surveys –Site visits Measuring pollutant load reductions (monitoring)
")
37
Implementation Measurements Versus Impact Measurements ImplementationImpact Basin Sampling 1)No. of storms monitored 2)Correct protocols followed 3)Percent of storm captured 4)Accidental drownings 1)Pollutant Removal 2)Influent Concentration 3)Discharge Concentration 4)Water Quality Construction Inspections 1)No. of facilities inspected 2)Training Materials Distributed 3)Preparation time 1)BMPs implemented 2)BMP implementation rate 3)Water Quality
Correct protocols followed 3)Percent of storm captured 4)Accidental drownings 1)Pollutant Removal 2)Influent Concentration 3)Discharge Concentration 4)Water Quality Construction Inspections 1)No. of facilities inspected 2)Training Materials Distributed 3)Preparation time 1)BMPs implemented 2)BMP implementation rate 3)Water Quality.")
38
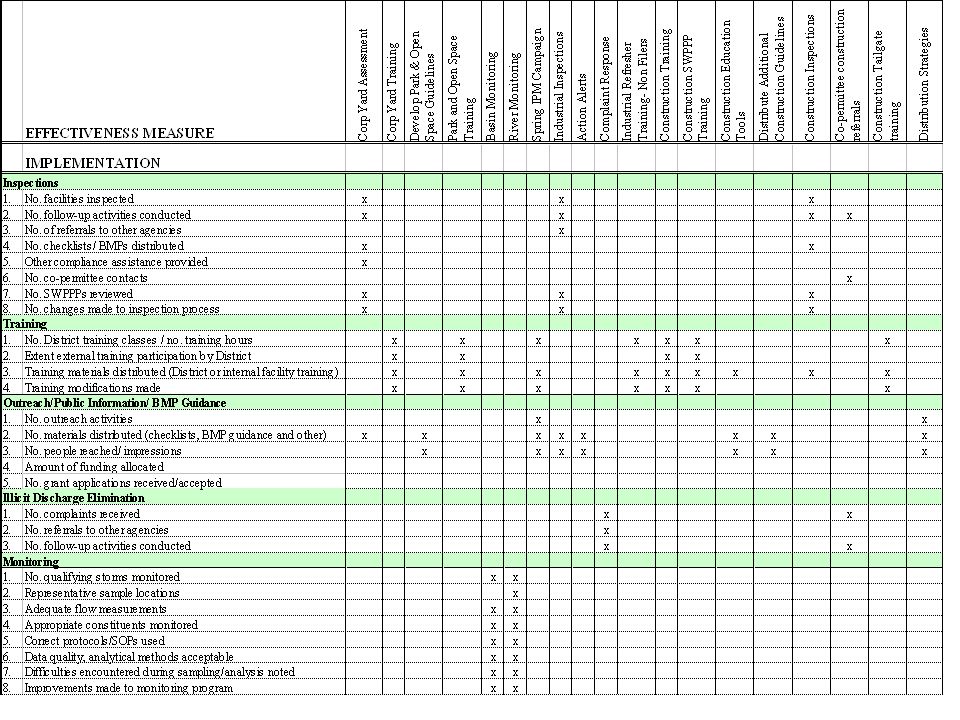
Evaluation Measures Matrix Columns -Task Name -Desired result -Targeted Pollutant -Targeted Audience -Program Implementation Measure -Impact Measurement -Resource Required

39
Task NameDesired Result Targeted Pollutants Targeted Audience Evaluation Measures for Program Implementation Evaluation Measures for Program Impacts Resources Required 1) Corporation yard assessments (implement supervisory oversight) Increased awareness of potential site pollutants and sources Increase in BMP implementation Decrease in corporation yard pollutants Knowledge of runoff water quality PAHs, oil and grease, solvents, metals, sediment, herbicides, nutrients, debris, misc raw/bulk materials (e.g., asphalt grindings, sand, gravel), detergents/ surfactants Corporation yard managers and staff No. facilities evaluated No. corrective measures identified at each facility No. follow-up site visits to evaluate corrective measure implementation No. inspection checklists and BMP guidance distributed to facility managers (% of total) No. SWPPPs reviewed by District during supervisory inspections Amount of other assistance provided to facility manager (evaluating NEC criteria, or need for WDRs) No. changes made to supervisory inspection process for future inspections Measure increase/decrease in: 1. No. BMPs implemented 2. No. corrective actions identified/ implemented 3. Consider inspection score to evaluate 1. and 2. 4. No. water quality objective exceedances (as indicated by sampling data) 5. No. SWPPPs developed and implemented 6. No inspections conducted by corporation yard staff 7. No. storm events sampled 1. Medium 2. Medium 3. Medium 4. High 5. Low 6. Med 7. Low
 No. SWPPPs reviewed by District during supervisory inspections Amount of other assistance provided to facility manager (evaluating NEC criteria, or need for WDRs) No. changes made to supervisory inspection process for future inspections Measure increase/decrease in: 1. No. BMPs implemented 2. No. corrective actions identified/ implemented 3. Consider inspection score to evaluate 1. and No. water quality objective exceedances (as indicated by sampling data) 5. No. SWPPPs developed and implemented 6. No inspections conducted by corporation yard staff 7. No. storm events sampled 1. Medium 2. Medium 3. Medium 4. High 5. Low 6. Med 7. Low.")
42
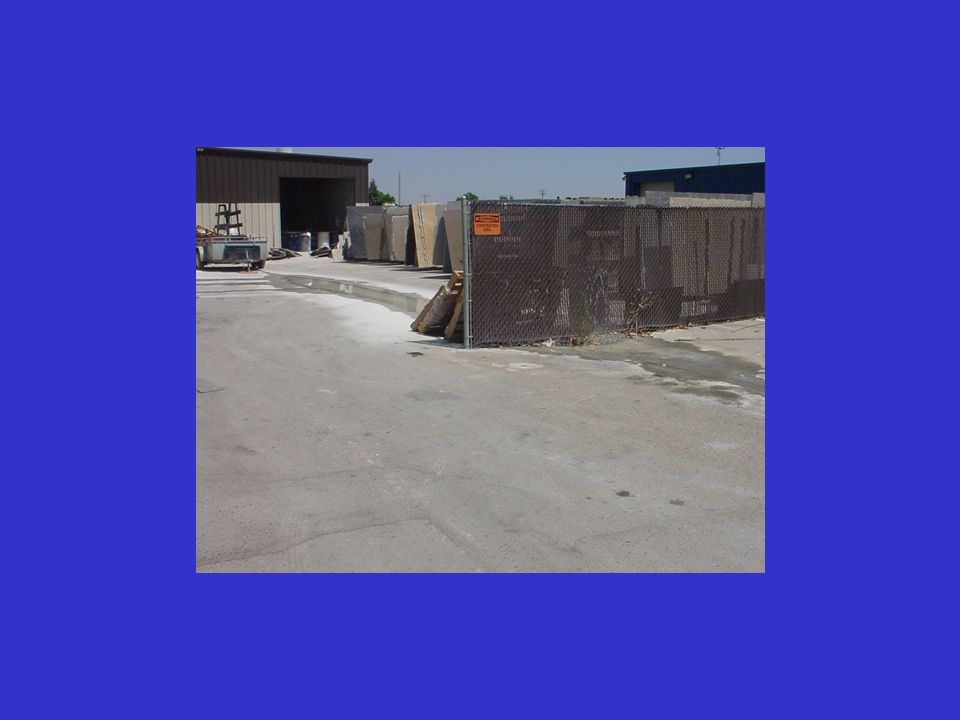
Implementation of Evaluation Measures Developed access database for Construction and industrial inspection and complaint investigations Included evaluation measures in project design and project deliverables Anticipated regulatory temperature – evaluated know areas of future concern.

43
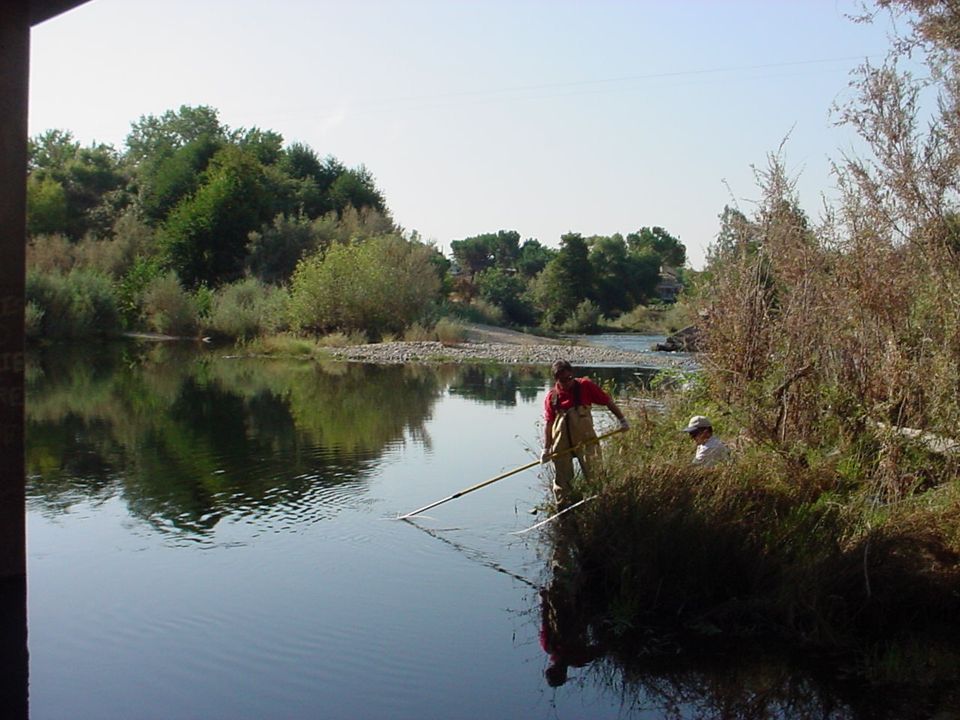
Visual Observations Training Succeeded

45
Visual Observation Continued Get out in the field !

48
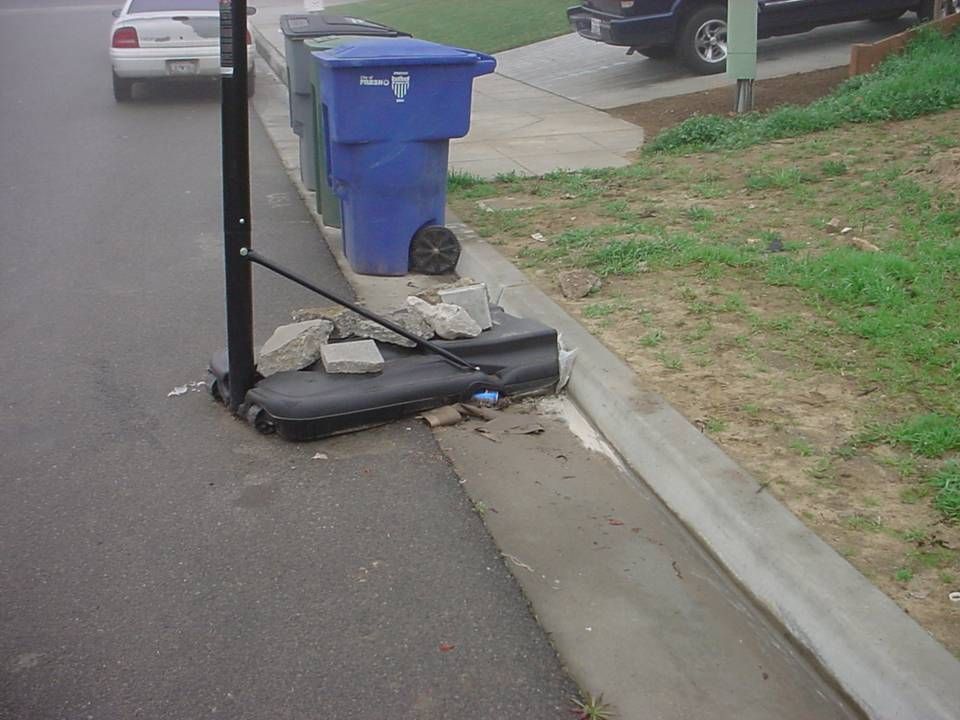
Complaint evaluation Sediment complaint increased- Increased training of field workers Decreased paint & oil complaints– many years of multi agency outreach

52
Effectiveness Measures are Good Because They: 1)Improve efficiency of limited resources 2)Improves negotiating power during permit renewal 4)Keeps you out of trouble 3)Gets rid of dead wood
Improve efficiency of limited resources 2)Improves negotiating power during permit renewal 4)Keeps you out of trouble 3)Gets rid of dead wood")
53
HOW TO CONTACT ME AT THE FRESNO METROPOLITAN FLOOD CONTROL DISTRICT Daniel Rourke danielr@fresnofloodcontrol.org 456-3292

Similar presentations


 Reduction Presenter: Keith Noble, Saginaw Bay District Office.>")


 Utah Sewer Management Program (USMP)>")


