Download presentation
Presentation is loading. Please wait.

1
Distance measure Point A: UTM Eastings = 450,000m; Northings = 4,500,000m Point B: UTM Eastings = 550,000m; Northings = 4,500,000m

2
State Plane Coordinate System Each state has one or more zones Zones are either N-S or E-W oriented (except Alaska) Each zone has separate coordinate system and appropriate projection Unit: feet no negative numbers
 Each zone has separate coordinate system and appropriate projection Unit: feet no negative numbers")
3
Map Projections for State Plane Coordinate System N-S zones: E-W zones:

5
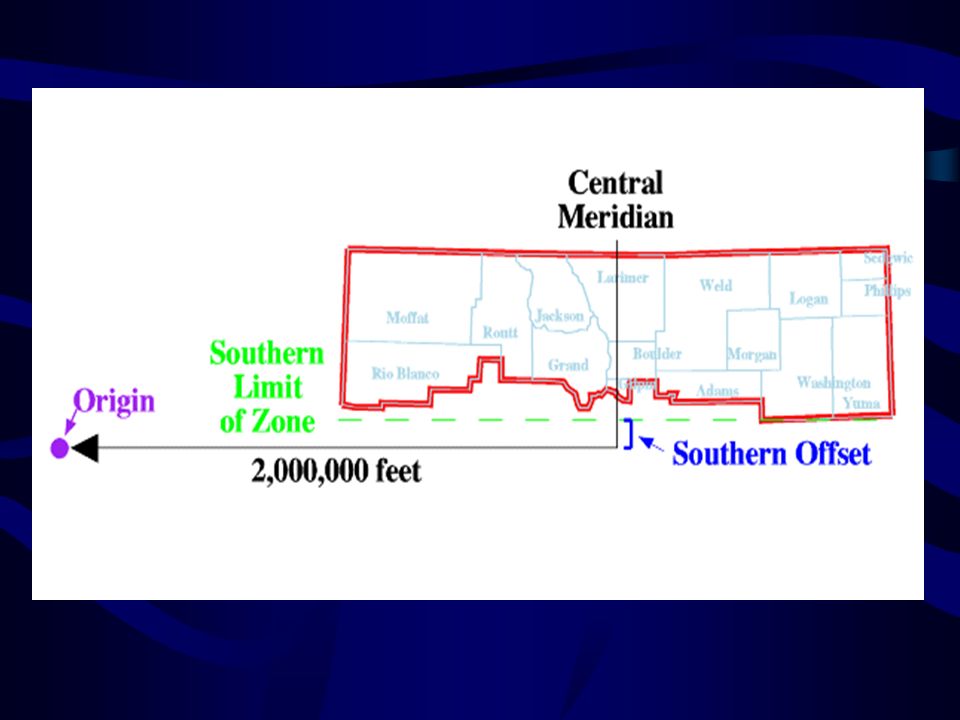
SPCS The origin for each zone is placed outside the zone to the southwest (a false origin) X-origin: –Transverse Mercator (N-S) Zones 500,000 feet west of the furthest point west –Lambert Conformal Conic (E-W) Zones 2,000,000 feet west of the furthest point west Y-origin is not a specific distance to the south (varies by state and zone)
 X-origin: –Transverse Mercator (N-S) Zones 500,000 feet west of the furthest point west –Lambert Conformal Conic (E-W) Zones 2,000,000 feet west of the furthest point west Y-origin is not a specific distance to the south (varies by state and zone)")
6
Use of SPCS Advantages: The system is used primarily for engineering applications e.g. utility companies, local governments to do accurate surveying of facilities network (sewers, power lines) More accurate than UTM. SPCS deals with smaller area Disadvantages: Lack of universality cause problems for mapping over large areas such as across zones and states
 More accurate than UTM. SPCS deals with smaller area Disadvantages: Lack of universality cause problems for mapping over large areas such as across zones and states.")
7
Data source “Very few GIS projects have to start with no data at all. “ Data collected and made available by the various branches of government and third party vendors Finding existing map data?

8
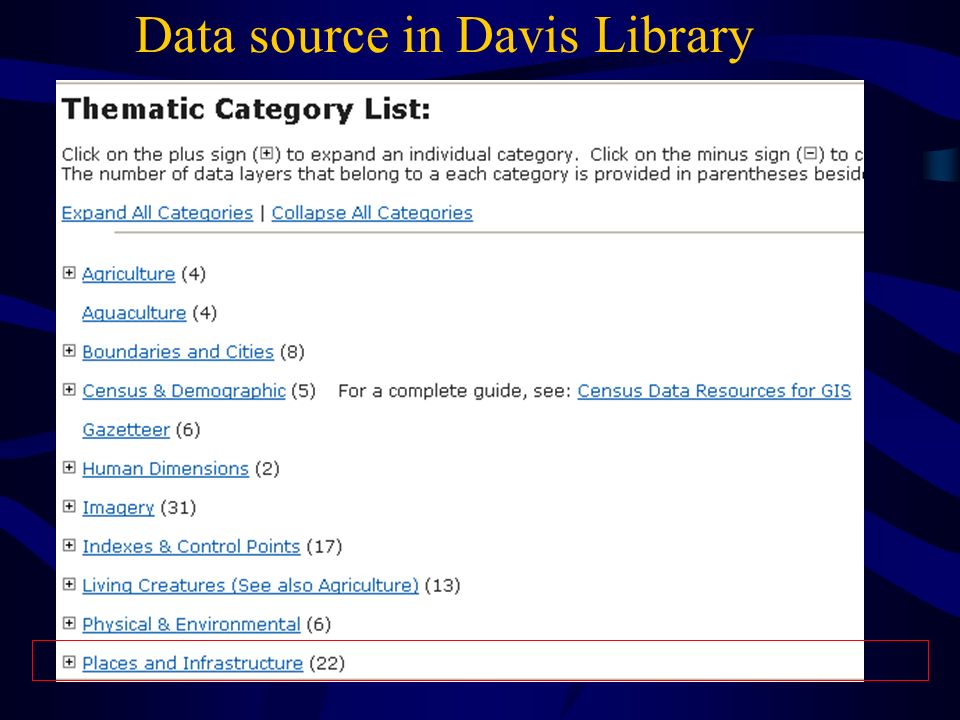
Data source in Davis Library

10
North Carolina Center for Geographic Information and Analysis

11
Florida Florida Geographic Data Library (FGDL)
")
12
Government data providers U.S. Geological Survey –Imagery, DEMs, DRGs, DLGs U.S. Census Bureau –TIGER National Oceanic & Atmospheric Agency –Coastal management –Oil & chemical spills –Coral reef conservation Natural Resource Conservation Service –STATSGO (U.S. General Soil Map)
.")
13
Data from USGS Digital line graphs (DLGs) Digital elevation model (DEMs) Land use and land cover digital data Digital cartographic text Digital orthophotoquads (DOQ) Digital raster graphics (DRG)
 Digital elevation model (DEMs) Land use and land cover digital data Digital cartographic text Digital orthophotoquads (DOQ) Digital raster graphics (DRG)")
14
U.S. Geological Survey Satellite image http://edcimswww.cr.usgs.gov/pub/imswelcome/

15
US Census Bureau TIGER/Line Files TIGER=Topologically Integrated Geographic Encoding and Referencing US Census Bureau’s TIGER system automates the mapping and related geographic activities required to support the decennial census and sample survey program of the US census Bureau with the 1990 decennial census. First comprehensive GIS database at street level for the entire United States

16
Data Content of the TIGER/Line Files Three major types: Line features: roads, railroads, hydrography, and boundaries Landmark features: (1) Point landmark: schools, churches etc. (2) area landmark: parks, cemeteries etc. Polygon features: geographic entities Note: line and polygon features are the majority of data Topology: provides the foundation for organizing spatial objects in the census TIGER data base.
 area landmark: parks, cemeteries etc. Polygon features: geographic entities Note: line and polygon features are the majority of data Topology: provides the foundation for organizing spatial objects in the census TIGER data base..")
17
Third Party Vendors ESRI TeleAtlas Map Databases DeLorme Street Atlas & Topo Usa GeoCommunity Data Bundles

18
Creating New Data Digitizing Scanning Field and Image data

19
–Digitizing Transforms information from analog format (e.g., paper, Mylar) digital format for computer storage & display Vector data capture Methods –Digitizing tablet –On screen digitizing using PC
 digital format for computer storage & display Vector data capture Methods –Digitizing tablet –On screen digitizing using PC")
20
Digitizing Tablet Electronically active table surface –Fine grid of wires acts as a Cartesian coordinate system –Small & large formats available http://www.calmit.unl.edu/geog412/Digitizing.pdf

21
Digitizing Tablet Puck –Connected to tablet –Records locations from map –Crosshair feature locator –Buttons indicate beginning/ending of lines/polygons, left/right polygons

22
Also called “heads-up” digitizing On-screen digitizing w/ PC http://www.esri.com/news/arcnews/winter0102articles/epas-clean-water.html

23
Input devices: Scanners Types: –Desktop scanner –Drum scanners “Drum scanner receives an entire sheet map, usually clamped to a rotating drum, and scans the map with very fine increments of distance.”

24
Raster Data Input: Remote Sensing Aerial photography –Source of base map data for many products check products 1 st –Distortions caused by scale, relief, tilt Orthophotos/orthophotoquads –Type of aerial photo Corrected for scale, relief, tilt distortion Available in analog & digital formats Satellite Imagery –Requires geometric & radiometric processing Geometric processing: GCPs –Classification & accuracy assessment

25
GPS Data Input Supports development of highly accurate geodetic control Links field data collection to locations Cost & accuracy vary

Similar presentations