Download presentation
Presentation is loading. Please wait.

1
Best Practices for Collecting Counts and Risk Evaluation for Bicyclists and Pedestrians Krista Nordback, P.E., Ph.D., PSU Taylor Phillips, PSU Mike Sellinger, MURP, Alta Planning & Design Mike Lowry, Ph.D., Civil Engineering University of Idaho

2
Overview Background Traffic Safety Traffic Monitoring Estimating Pedestrian and Bicycle Miles Traveled Bicycle Volume Estimation Risk Exposure Analysis Next Steps

3
Traffic Safety

4
Risk = Crashes per Vehicle Individual Risk SAFETY IN NUMBERS!

5
Individual Bicyclist Risk 200 600 Danger Zone Safety Zone

6
Traffic Monitoring Programs

7
Permanent Counters

8
Short Duration Counters

9
AADT and VMT Sum (AADT X Segment Length) over network to compute Vehicle Miles Traveled (VMT)
 over network to compute Vehicle Miles Traveled (VMT)")
10
Can we apply these methods to biking and walking?

11
AADB: Annual Average Daily Bicyclists AADT for bicyclists!

12
Permanent Counters in 2012 Bicycle Counter

13
Permanent Counters in Spring 2015 Bicycle Counter Bicycle and Pedestrian Counter

14
Short Duration Counts Annual Sept/Oct, volunteer manual counts, morning and evening peak hours

15
Estimating Pedestrian and Bicycle Miles Traveled (PMT/BMT) in Washington State
 in Washington State")
16
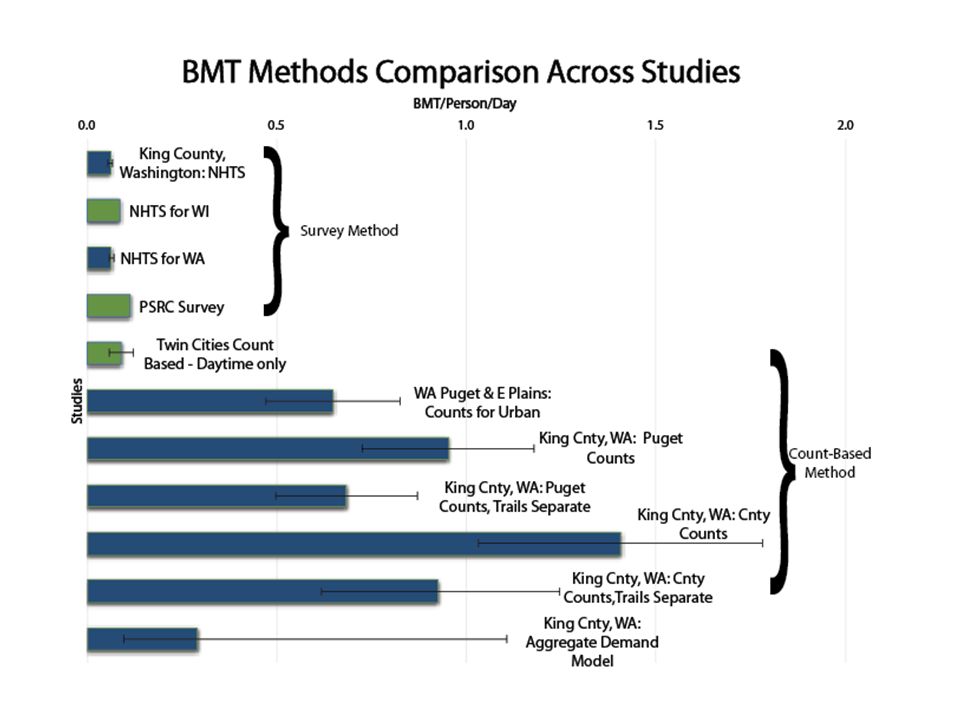
Pedestrian/Bicycle Volume Estimates Travel Surveys Sample-based approach Aggregate demand model BMT/PMT

17
National Household Survey Method “Back of the envelope” method Uses research from Pucher et al. NHTS and Census Data Puget Sound Regional Travel Survey

18
X = Road Segment Length Aggregate Demand Model = Sample Based BMT/PMT Aggregate Demand BMT/PMT AADB/ AADP

19
Sample-based Method PMT & BMT = Road or path length per group X AADB/ AADP X 365 days/year per day

20
4 Regions X 2 Urbanity Levels X 2 Road Types = 16 Groups

21
Aggregate Demand Model AADB and AADP associated with… – Facility type: Local and collector roads Arterial roads and highways Trail – Bridge – Population density – Percent of population aged 18 to 54 – Percent of population with a four-year degree

23
Conclusions ApproachProsCons Sample-based Data are at the facility level. - Data tend to be biased towards high count locations. - It is harder to sample pedestrian locations. Aggregate demand model More accurate estimate of PMT and BMT. Especially useful for pedestrian travel. Difficult to do at the state level. Travel survey Expanding existing dataset is easier than creating new dataset. Data are not at the facility level.

24
Bicycle Volume Estimation Risk Exposure Analysis

25
Moscow, Idaho

26
Observed Count Points Network-wide Volume Estimation Estimated Bike Volumes

27
Observed Bicycle Volume Count Locations

28
Estimated Bicycle Volume

29
AM 2 Hour Volume PM 2 Hour Volume AADB

30
Scenario Planning

31
Third Street Bicycle Volumes Existing and Forecasted Increase of about 150 bicyclists per day. Increase of about 200 bicyclists per day.

32
Scenarios S1: Existing Conditions S2: Proposed Improvements

33
Scenario 1 (Existing) Scenario 2 (Proposed) Estimated Bicycle Volumes
 Scenario 2 (Proposed) Estimated Bicycle Volumes")
34
Right Hook Exposure

35
Dangerous Situation Risk Exposure Condition Scenario 1: Existing Conditions (AADB) Scenario 2: w/Proposed Improvements (AADB) Change (AADB) Percent Change (%) Hazardous crossing Cross street vehicles: > 8,000 vehicles per day, > 50 mph, > 10% heavy vehicle 33,29731,595-1,702-5% Oncoming cross Oncoming left turning vehicles: > 2,000 vehicles per day 45,57742,516-3,061-7% Right hook Right turning vehicles: > 2,000 vehicles per day 51,60347,737-3,866-7% Left sneak Adjacent vehicles: > 8,000 vehicles per day 9,0158,798-217-2% Exposure at Intersections
 Scenario 2: w/Proposed Improvements (AADB) Change (AADB) Percent Change (%) Hazardous crossing Cross street vehicles: > 8,000 vehicles per day, > 50 mph, > 10% heavy vehicle 33,29731,595-1,702-5% Oncoming cross Oncoming left turning vehicles: > 2,000 vehicles per day 45,57742,516-3,061-7% Right hook Right turning vehicles: > 2,000 vehicles per day 51,60347,737-3,866-7% Left sneak Adjacent vehicles: > 8,000 vehicles per day 9,0158, % Exposure at Intersections")
36
Next steps: Improve volume estimation method through: Better spatial distribution of count locations Better spatial distribution of count locations Better short duration adjustment factors Better short duration adjustment factors Improve risk exposure method through: Comparison of exposure and crash data Comparison of exposure and crash data

37
Guidebook for Counting (Exposure Data Collection)
")
38
Future Research Research 1. Gather data and create factors 4. Guidebook for Communities 2. Evaluate when and how long to count. 3. Evaluate spatial extent of factors applicability.

39
Discussion & Questions Krista Nordback, P.E., Ph.D. nordback@pdx.edu 503-725-2897 Taylor Phillips tphill2@pdx.edu Mike Lowry, Ph.D. mlowry@uidaho.edu

Similar presentations


>")
 Be able to.>")


 in Washington State Krista Nordback, P.E., Ph.D. Mike Sellinger, MURP Taylor Phillips.>")