Download presentation
Presentation is loading. Please wait.

1
Mining Economics Minnesota Minerals Education Workshop June 16, 2015 By Peter Clevenstine Division of Lands & Minerals Department of Natural Resources

2
USA Metal Consumption

3
USA Consumption Metric Tons

4
What is an Ore? Rock/Mineral that can be sold at a profit Rock/Mineral that can be sold at a profit Types of minerals Types of minerals Fuels – coal, oil, gas Metallic minerals - Ferrous and non ferrous Industrial minerals - Sand & gravel, limestone, phosphate, quarries, clay

5
Principal Ore Minerals Non Ferrous (Non Iron) Non Ferrous (Non Iron) Sulfide minerals – Copper, Nickel, Cobalt, Platinum, Paladium Bauxite – Aluminum ores Bauxite – Aluminum ores Hydrated alumina oxide minerals - Gibbsite Al 2 O 3 – 3H 2 O, Boehmite Al 2 O 3 – H 2 O
 Non Ferrous (Non Iron) Sulfide minerals – Copper, Nickel, Cobalt, Platinum, Paladium Bauxite – Aluminum ores Bauxite – Aluminum ores Hydrated alumina oxide minerals - Gibbsite Al 2 O 3 – 3H 2 O, Boehmite Al 2 O 3 – H 2 O")
6
Principal Ore Minerals Iron ores Iron ores Hematite Fe 2 O 3 Magnetite Fe 3 O 4

7
Minnesota Mesabi Range Providing Iron Ore to the North American Steel Industry every year - Since 1892 Hibbing

8
Mesabi Range Iron Ore Production (Natural Ore and Pellets) Source: MN Department of Revenue
 Source: MN Department of Revenue")
9
Active Permit to Mine Areas

10
Mesabi Iron Range Range Cities Grand Rapids Babbitt Nashwauk Hibbing Eveleth Virginia Aurora

11
Current pits 2020 2050 Beyond 2050 Auxiliary lands Chisholm Keewatin Nashwauk Hibbing Calumet

12
Iron Ore Resource Modeling Sherman Example Sherman

13
Potential Mining Areas S M

14
Exploration Drilling S M

15
Cross-Section 1 S M

17
S M

18
Cross-Section 2 S M

20
S M

21
Subject Area S M

22
Cross-Section 1

23
Resource Modeling

24
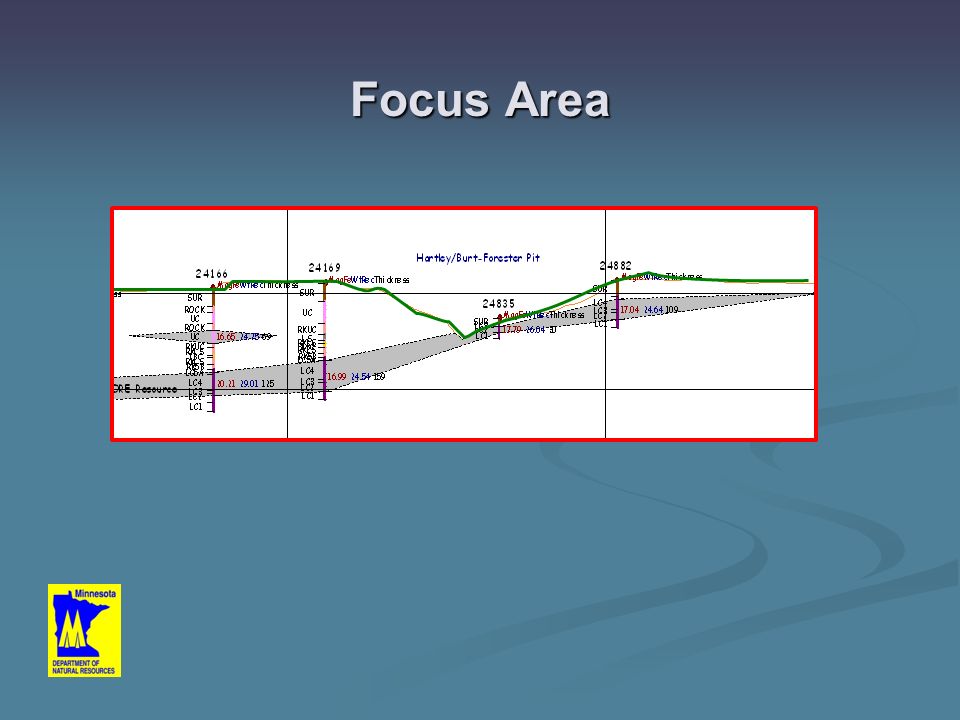
Focus Area

26
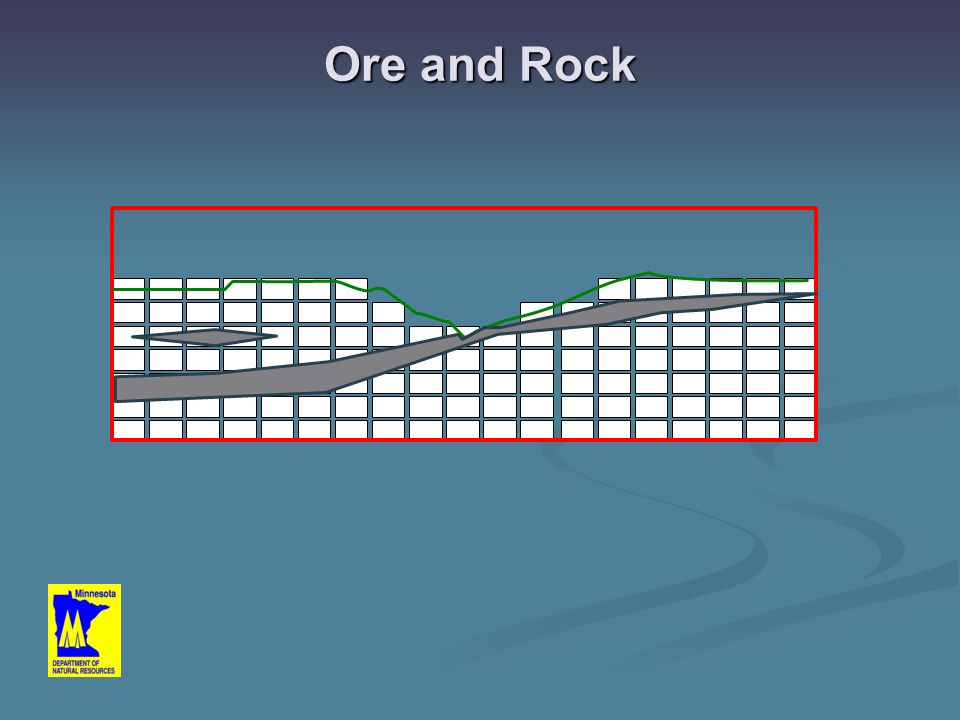
Block Model Section View

27
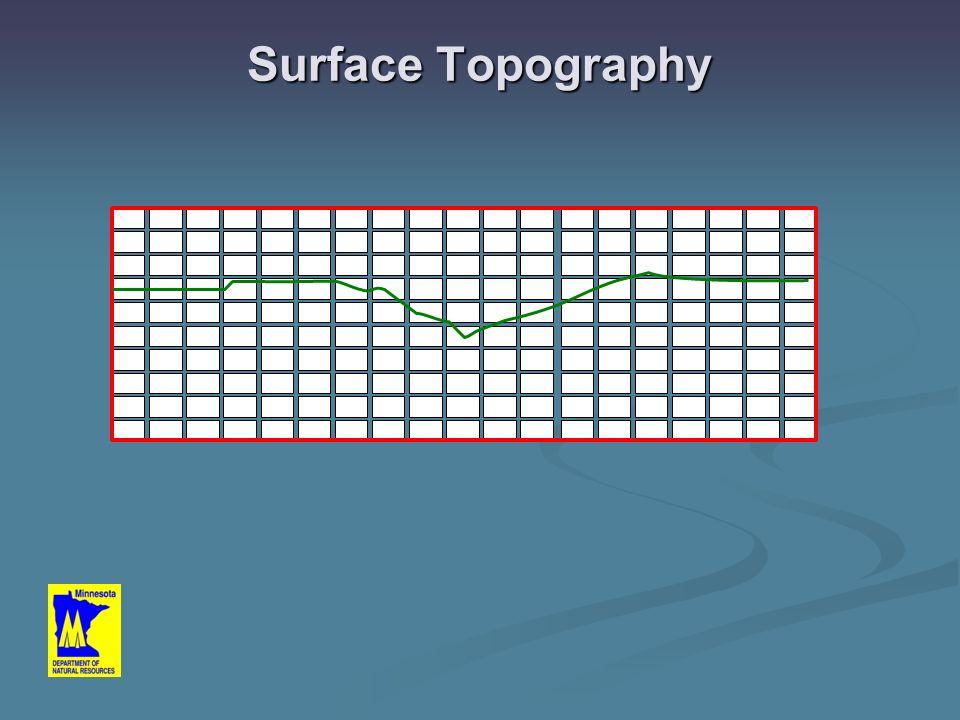
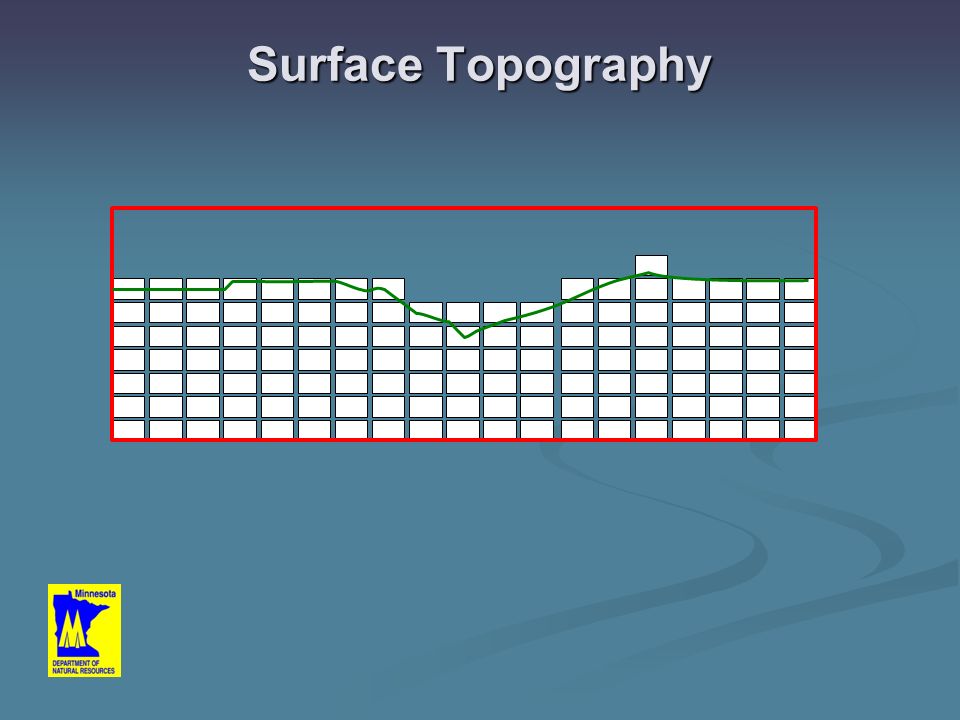
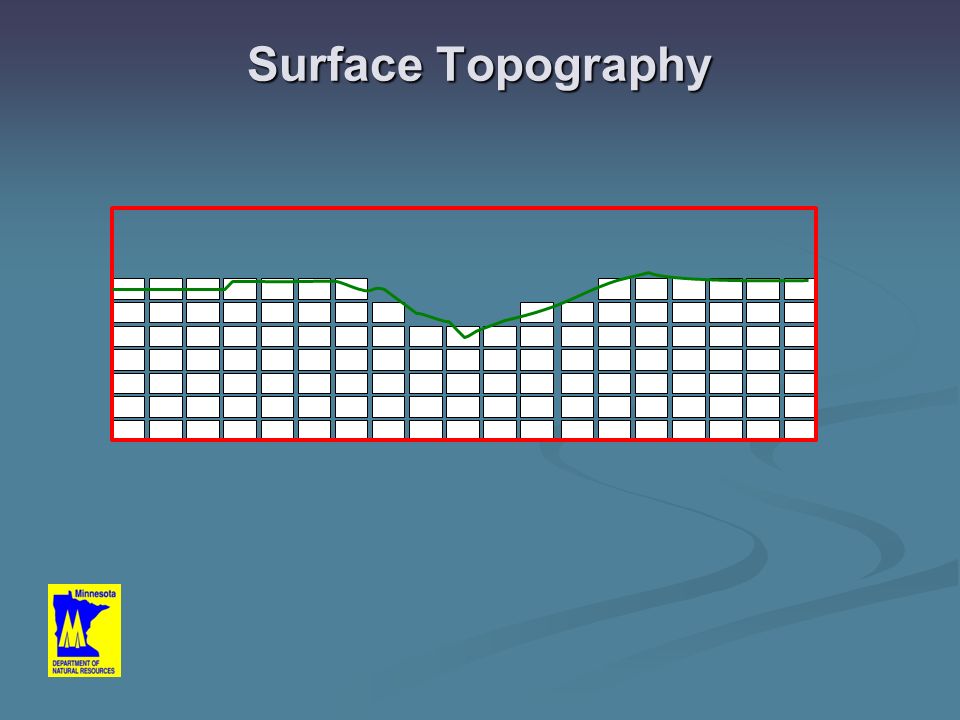
Surface Topography

31
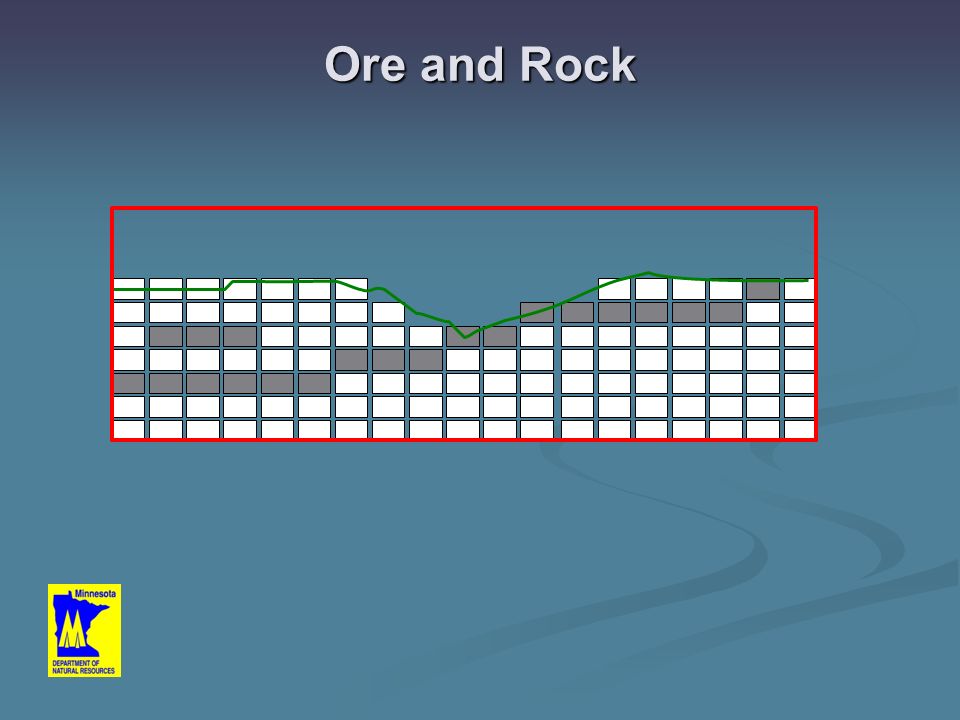
Ore and Rock

34
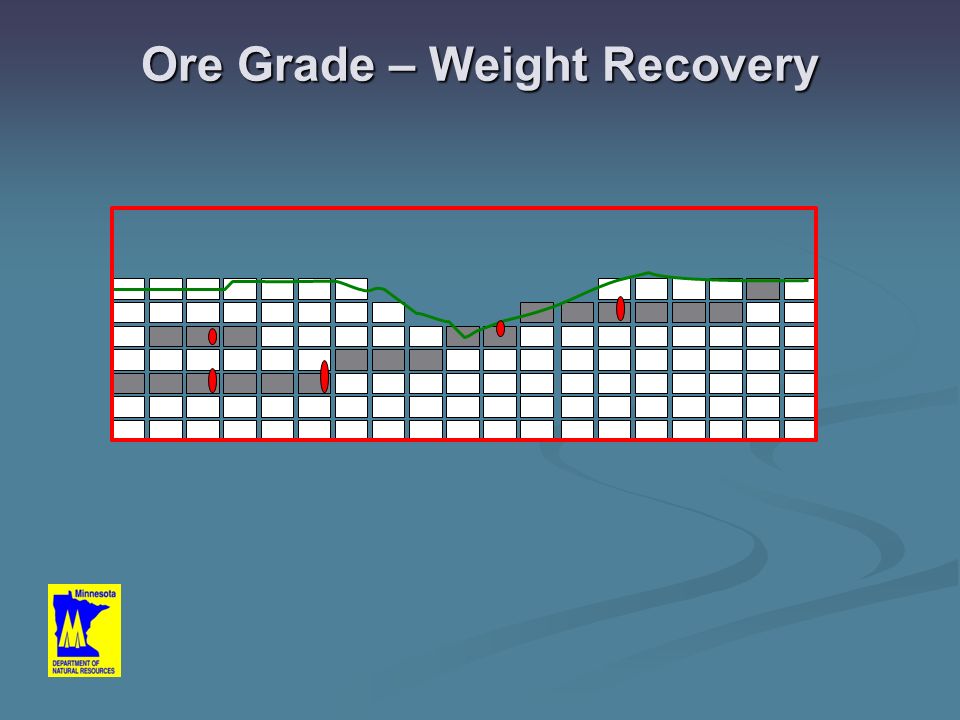
Ore Grade – Weight Recovery

36
24.75 29.0124.54 26.04 24.64

37
24.75 29.0124.54 26.04 24.64 24.7524.75 29.0129.0127.8026.20 24.6424.6424.64 24.64 25.3425.34 25.2925.29 26.04 24.54

38
Mine Cost Information 2008 Taconite Pellet Production Cost Crude OreRock Block 200x200x100 380,000 Tons350,000 Tons Per TonPer BlockPer TonPer Block Mining cost$2.15 Processing7.72 - - - Royalty1.00 - - - Admin1.71 - - - Taxes 0.87 - - - $13.45$5,110,000$2.15$752,500

39
Taxable Mine Value 2008 Taconite Pellet Value - $80.96/ton Crude OreRock Block 200x200x100 380,000 Tons350,000 Tons Weight Recovery Revenue Per Ton Revenue Per Block Revenue Per Ton Revenue Per Block 24%$19.43$7,383,000 - - - 26%$21.05$7,999,000 - - - 28%$22.67$8,615,000 - - - 30%$24.29$9,230,000 - - 32%$25.91$9,846,000 - -

40
Net Value per Block Revenue Per Block Cost per Block Net Value per Block Rock- 0 -($752,500) Crude Ore Weight Recovery 24%$7,383,000($5,110,000)$2,273,000 26%$7,999,000($5,110,000)$2,889,000 28%$8,615,000($5,110,000)$3,505,000 30%$9,230,000($5,110,000)$4,120,000 32%$9,846,000($5,110,000)$4,736,000
 Crude Ore Weight Recovery 24%$7,383,000($5,110,000)$2,273,000 26%$7,999,000($5,110,000)$2,889,000 28%$8,615,000($5,110,000)$3,505,000 30%$9,230,000($5,110,000)$4,120,000 32%$9,846,000($5,110,000)$4,736,000")
41
Ore Grade – Weight Recovery 24.75 29.0124.54 26.04 24.64 24.7524.75 29.0129.0127.8026.20 24.6424.6424.64 24.64 25.3425.34 25.2925.29 26.04 24.54

42
Economic Pit 0.750.750.750.750.750.750.75 0.750.750.750.75 0.75 0.750.750.750.75 0.75 0.75 0.75 0.75 0.75 0.75 0.75 0.75 0.75 0.750.75 0.750.750.750.75 2.502.502.50 3.813.813.813.442.952.44 2.442.672.67 2.47 2.902.90 2.692.692.472.472.47 2.47

43
Net Value $28.2 Million 0.750.750.750.750.750.750.75 0.750.750.750.75 0.75 0.750.750.750.75 0.75 0.75 0.75 0.75 0.75 0.75 0.75 0.75 0.75 0.750.75 0.750.750.750.75 2.502.502.50 3.813.813.813.442.952.44 2.442.672.67 2.47 2.902.90 2.692.692.472.472.47 2.47 10,850,000 tons rock 7,980,000 tons ore

44
0.75 0.75 0.75 0.75 Net Value Southern Limit? 0.750.750.750.750.750.75 0.750.750.75 0.750.750.75 0.75 0.75 0.75 0.75 0.75 0.75 0.75 0.75 0.75 0.750.75 0.750.750.750.75 2.502.502.50 3.813.813.813.442.952.44 2.442.672.67 2.47 2.902.90 2.692.692.472.472.47 2.47 14,350,000 tons rock 7,980,000 tons ore $20.7 Million Net Value 0.75 0.75 0.75 0.75 0.75 0.75 0.75 0.75 0.75 0.75

45
How does a mining company evaluate the cost of environmental measures? A mining company may be asked to do something different and we hear a mining company say they can, or they cannot, afford to do it. How is that determination made?

46
Project Time Line Exploration Environmental Review Construction Production Closure

47
Next Steps Delineate the resource with available data and preliminary economics. Identify additional drilling and/or analysis that would help further define this resource. Create mining plans Auxiliary lands necessary to extract the resource.

48
Economic Pit 37 blocks of rock 21 blocks of ore

49
Mine Scheduling OreRockTotal Period 14711 Period 24913 Period 34913 Period 45813 Period 5 4 4 8 213758

50
Mine Sequencing Period One 7 blocks of rock 4 blocks of ore 4th4th4th 5th5th5th5th4th4th 3rd3rd3rd 2nd 2nd3rd 2nd2nd

51
Mine Sequencing Period Two 9 blocks of rock 4 blocks of ore 4th4th4th 5th5th5th5th4th4th 3rd3rd3rd 3rd

52
Mine Sequencing Period Three 9 blocks of rock 4 blocks of ore 4th4th4th 5th5th5th5th4th4th

53
Mine Sequencing Period Four 8 blocks of rock 5 blocks of ore 5th5th5th5th

54
Mine Sequencing Period Five 4 blocks of rock 4 blocks of ore

55
Mining Cost Period 1Period 2Period 3Period 4Period 5 Rock tons Ore tons Mining cost

56
Processing Cost and Revenue Period 1Period 2Period 3Period 4Period 5 Ore tons Ore grade Processing cost Revenue

57
Additionally Preproduction costs Preproduction costs Land position ExplorationFeasibility Environmental review/permitting Construction Post production Post production

58
Project Time Line Exploration Environmental Review Construction Production Closure

59
Project Cash Flow Earnings before Interest, Taxes, Depreciation & Amortization Year12345678910Total Cash in-$1.00-$3.00-$10.00-$14.00 Project Earnings $3.00$4.00$3.00$5.00$3.00 -$3.00$18.00 Cumulative-$1.00-$4.00-$14.00-$11.0-$7.00-$4.00$1.00$4.00$7.00$4.00 $14 Investment $18 Earnings $ 4 Profit Payback in 3 to 4 years of production

60
Evaluate Investment Options Upfront Investment Upfront Investment Net Present Value Net Present Value Internal Rate of Return Internal Rate of Return

61
Upfront Investment Capital - $ Capital - $ Labor - People Labor - People Management & Administrative Management & Administrative

62
Net Present Value Value today of a dollar amount at some specific point of time Value today of a dollar amount at some specific point of time Considers that a dollar invested today would earn interest Considers that a dollar invested today would earn interest Interest rate, or present value factor, is a function of a company’s cost of money (debt & equity) and risk tolerance Interest rate, or present value factor, is a function of a company’s cost of money (debt & equity) and risk tolerance
 and risk tolerance Interest rate, or present value factor, is a function of a company’s cost of money (debt & equity) and risk tolerance")
63
Time Value of Money Year12345678910Total Cash in-$1.00-$3.00-$10.00-$14.00 Project Earnings $3.00$4.00$3.00$5.00$3.00 -$3.00$18.00 Cumulative-$1.00-$4.00-$14.00-$11.0-$7.00-$4.00$1.00$4.00$7.00$4.00 Beginning$1.00$4.05$14.25$14.96$15.71$16.50$17.33$18.20$19.11 Interest @5% $0.05$0.20$0.71$0.75$0.79$0.83$0.87$0.91$0.96$6.07 Cash in$1.00$3.00$10.0014.00 Ending$1.00$4.05$14.25$14.96$15.71$16.50$17.33$18.20$19.11$20.07

64
Net Present Value Year (n) 012345678910 10% Discount Rate (i) Current$1.00 PV Factor 1/(1+i) n 1.00000.90910.82640.75130.68300.62090.56450.51320.46650.42410.3855 Present Value $1.00$0.91$0.83$0.75$0.68$0.62$0.56$0.51$0.47$0.42$0.39 5% Discount Rate (i) Current$1.00 PV Factor 1/(1+i) n 1.00000.95240.90700.86380.82270.78350.74620.71070.67680.64460.6139 Present Value $1.00$0.95$0.91$0.86$0.83$0.78$0.75$0.71$0.68$0.64$0.61
 % Discount Rate (i) Current$1.00 PV Factor 1/(1+i) n Present Value $1.00$0.91$0.83$0.75$0.68$0.62$0.56$0.51$0.47$0.42$0.39 5% Discount Rate (i) Current$1.00 PV Factor 1/(1+i) n Present Value $1.00$0.95$0.91$0.86$0.83$0.78$0.75$0.71$0.68$0.64$0.61")
65
Net Present Value Year12345678910Total Cash in-$1.00-$3.00-$10.00 Project Earnings $3.00$4.00$3.00$5.00$3.00 -$3.00 Cash Flow-$1.00-$3.00-$10.00$3.0$4.00$3.00$5.00$3.00 -$3.00 5% Discount Rate (i) PV Factor 1/(1+i) n 0.95240.90700.86380.82270.78350.74620.71070.67680.64460.6139 Present Value -$0.95-$2.72-$8.64$2.47$3.13$2.24$3.55$2.03$1.93-$1.84$1.20 10% Discount Rate (i) PV Factor 1/(1+i) n 0.90910.82640.75130.68300.62090.56450.51320.46650.42410.3855 Present Value -$0.91-$2.48-$7.51$2.05$2.48$1.69$2.57$1.40$1.27-$1.16-$0.59
 PV Factor 1/(1+i) n Present Value -$0.95-$2.72-$8.64$2.47$3.13$2.24$3.55$2.03$1.93-$1.84$ % Discount Rate (i) PV Factor 1/(1+i) n Present Value -$0.91-$2.48-$7.51$2.05$2.48$1.69$2.57$1.40$1.27-$1.16-$0.59")
66
Internal Rate of Return Discount Rate where the sum of the Net Present Values of a stream of cash flows is zero. Discount Rate where the sum of the Net Present Values of a stream of cash flows is zero.

67
Internal Rate of Return Year12345678910Total Cash in-$1.00-$3.00-$10.00 Project Earnings $3.00$4.00$3.00$5.00$3.00 -$3.00 Cash Flow-$1.00-$3.00-$10.00$3.0$4.00$3.00$5.00$3.00 -$3.00 8.1% Discount Rate (i) PV Factor 1/(1+i) n 0.92500.85580.79160.73230.67740.62670.57970.53630.49610.4589 Present Value -$0.93-$2.57-$7.92$2.20$2.71$1.88$2.90$1.61$1.49-$1.38$0.00
 PV Factor 1/(1+i) n Present Value -$0.93-$2.57-$7.92$2.20$2.71$1.88$2.90$1.61$1.49-$1.38$0.00")
68
How does a mining company evaluate the cost of environmental measures? A mining company may be asked to do something different and we hear a mining company say they can, or they cannot, afford to do it. How is that determination made?

69
How Environmental Measures Effect Mining Cost 1. Delaying construction and subsequent production 2. Increased construction cost 3. Higher mining or processing cost 4. Less mine reserves/shortened mine life 5. Mine closure expense

70
Project Time Line Exploration Environmental Review Construction Production Closure

71
Peter.Clevenstine@state.mn.us 218-231-8443 mndnr.gov

Similar presentations


 May 9, 2009. This presentation may contain forward-looking information including expectations of future production,>")

 2001 Contemporary Engineering Economics 1 Chapter 11 Corporate Income Taxes Income tax rates Average vs. Marginal tax rates Gains taxes Income tax.>")


 Week 5.>")