Download presentation
Presentation is loading. Please wait.

1
Using Data to Explore Ocean Processes Koshland Science Museum of the National Academy of Sciences

2
CTD + Niskin Bottles Conductivity Temperature Depth

3
75m 125m 10m

4
0 200 400 600 800 1000 Depth (m) Fluorescence 0 0.1 0.2 0.3 04 0.5 0.6 0.7 0.8 0.9 1.0 Temperature (ITS-90) 0 5 10 15 20 25 30 0 25 50 75 100 125 150 175 200 225 250 Oxygen uMol/kg 34.0 34.25 34.50 34.75 35.0 35.25 35.5 Salinity (PSU)
 Fluorescence Temperature (ITS-90) Oxygen uMol/kg Salinity (PSU)")
5
Phytoplankton form the base of the marine food web!

6
Photosynthesis Respiration and Decomposition CO 2 Carbon dioxide + H 2 O Water + O 2 Oxygen + nutrients e.g., nitrate, phosphate Organic carbon + O 2 Oxygen Organic carbon nutrients e.g., nitrate, phosphate H 2 O + Water CO 2 + Carbon dioxide

7
Nitrogenous base Marine Nitrogen Cycle

8
Photosynthesis Grazing Inorganic Nutrients (NO 3, PO 4 ) Dissolved Organic Matter e.g., ATP, lipids, sugars, proteins Respiration or Death
 Dissolved Organic Matter e.g., ATP, lipids, sugars, proteins Respiration or Death")
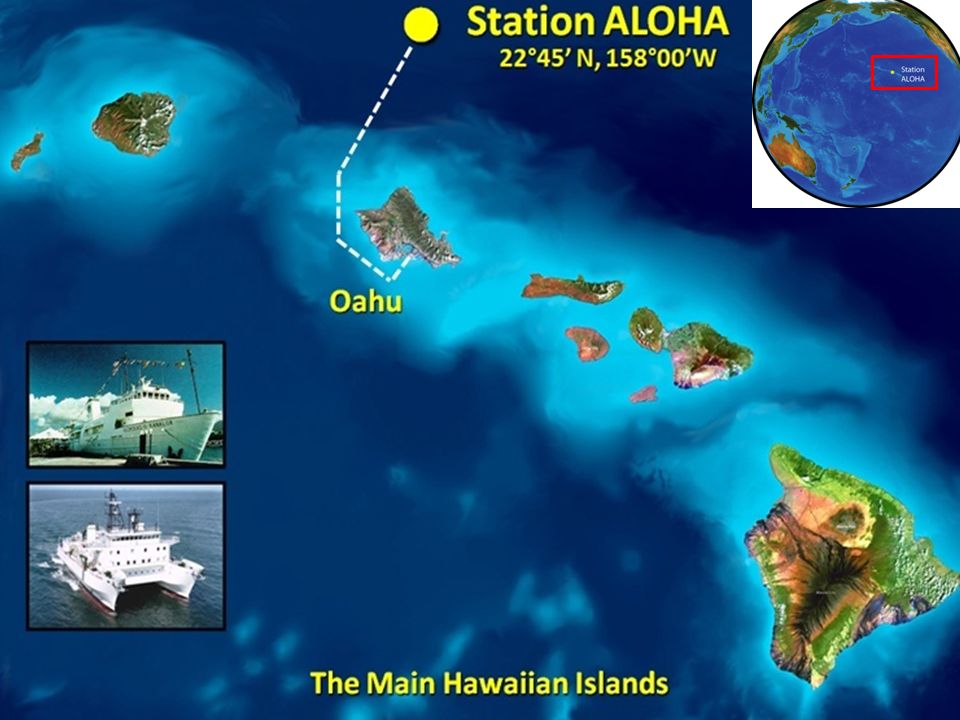
9
Long-term Oceanographic Research Hawaii Ocean Time-series (HOT) Started in October 1988 Scientists measure a wide range of variables in the Pacific Ocean
 Started in October 1988 Scientists measure a wide range of variables in the Pacific Ocean")
11
http:// hahana.soest.hawaii.edu/hot/hot-dogs/interface.html

12
Horizontal Profiles Time-series Bottle Time (year)
")
13
Let’s change the grouping Horizontal Profiles Time-series Bottle Highest oxygen during the spring Oxygen peak in 1991

14
Summary Scientists use technology, like CTDs, to study the ocean. Phytoplankton play important roles in food production and chemical cycling. Time-series are valuable for understanding large- scale ocean processes.

Similar presentations


 Photosynthesis.>")


 - dissolves solids and gases readily (“universal solvent”) Addition of dissolved.>")

 program Marine Microplankton Ecology>")


