Download presentation
Presentation is loading. Please wait.

1
@MNCompass Craig Helmstetter, PhD @c_helmstetter Community Indicators Consortium November 9, 2015 Helping to build an equitable workforce in our community (and yours)
")
2
Minnesota Compass provides a common foundation of information that people need to identify, understand, and effectively act on community issues. What is Minnesota Compass? Compass gives everyone in our state – policymakers, business and community leaders, and concerned individuals who live and work here – a common foundation of information to act on issues and improve our communities.

4
Minnesota’s population Of Color is smaller, but is growing faster than in the U.S. Twin Cities’ population Of Color more than tripled 37% 18% 25% 9% 6% Minnesota’s population Of Color more than tripled 24% US population Of Color doubled

5
Growth among all populations Of Color, but especially among… Asian and Black populations TRIPLED Hispanic population QUINTUPLED

6
Nearly all recent population growth is from populations of Color 6% <1% 10% <1% 9% 2% US Census Bureau data via MNCompass.org

7
1. Minnesota (tie) 1. New Hampshire (tie) 3. Vermont 4. Utah 5. Colorado How do we compare as a state? 1. Minnesota 2. Vermont 3. Utah 4. New Hampshire 5. Colorado

8
Top 10 on 15 key measures Middle (11-40) on 8 key measures Bottom 10 on 1 measure How do we compare as a state?
 on 8 key measures Bottom 10 on 1 measure How do we compare as a state")
9
Minnesota leads the nation in terms of employment Economy: Good news RankState (1=best) 1Nebraska77.8% 2South Dakota77.6% 3Minnesota77.3% 4North Dakota77.2% 5Iowa76.3% Proportion of adults (age 16-64) working, 2014 Rank 25 largest US Metro areas (1=best) 1Minneapolis-St. Paul78.0% 2Denver, CO75.5% 3Washington DC74.5% 4Boston, MA73.7% 5Seattle, WA71.8%

10
Employment rates are not nearly as strong for some groups Economy: Bad news RankState (1=best)2010-12 1New Hampshire77.2% 2Alaska76.2% 3North Dakota71.5% … 27Minnesota59.4% Proportion of African American adults (age 16-64) working RankState (1=best) Percentage points 1Alaska-3.3 2New Hampshire-2.3 3Hawaii0.5 … 48Minnesota18.5 Employment gap (White - Black)
 New Hampshire77.2% 2Alaska76.2% 3North Dakota71.5% … 27Minnesota59.4% Proportion of African American adults (age 16-64) working RankState (1=best) Percentage points 1Alaska-3.3 2New Hampshire-2.3 3Hawaii0.5 … 48Minnesota18.5 Employment gap (White - Black)")
11
How did we (& others) raise awareness?
 raise awareness")
12
2005

14
2007-08: Twin Cities Compass Launches

15
2008 Forum on Disparities

16
2009 Economic Policy Institute issues report highlighting racial disparities “The biggest black-white unemployment rate disparity was in the Minneapolis metropolitan area, where the black unemployment rate was 3.3 times the white rate.” -Black metropolitan unemployment in 2011

17
2011: Employment Disparities= main feature of Minnesota Compass Annual Event

18
2012 Wilder Research issues follow-up to “Mind the Gap” report

19
What was most compelling? 2012- and on Minnesota Compass asked to do several presentations focused on employment disparities

20
Proportion of adults (age 16-64) working for pay Source: Wilder Research analysis of 2008-2010 American Community Survey (www.MNCompass.org/workforce) Rate in MN MN’s Rank among counter-parts in other states Minnesota (all)75%4 th Non-Hispanic White78%5 th Of Color65%22 nd Gap White – Of Color 13 percentage points 46 th (nearly the biggest/worst)
 working for pay Source: Wilder Research analysis of American Community Survey ( Rate in MN MN’s Rank among counter-parts in other states Minnesota (all)75%4 th Non-Hispanic White78%5 th Of Color65%22 nd Gap White – Of Color 13 percentage points 46 th (nearly the biggest/worst)")
21
Proportion of adults (age 16-64) working for pay Source: Wilder Research analysis of 2008-2010 American Community Survey (www.MNCompass.org/workforce) Rate in MN MN’s Rank among counter-parts in other states Minnesota (all)75%4 th Non-Hispanic White78%5 th Of Color65%22 nd Hispanic70%8 th Asian69%20 th African American60%33 rd American Indian53%45 th
 working for pay Source: Wilder Research analysis of American Community Survey ( Rate in MN MN’s Rank among counter-parts in other states Minnesota (all)75%4 th Non-Hispanic White78%5 th Of Color65%22 nd Hispanic70%8 th Asian69%20 th African American60%33 rd American Indian53%45 th")
22
Scenarios that “inspire action” Additional $15 billion in personal income in the region Additional $1.75 billion in tax revenues

23
Scenario B If gaps are closed How much better will MN be than the U.S. in the future? Scenario A: If gaps persist 10% better 20% better Proportion of adults working Educational attainment Median Income www.mncompass.org Same as U.S.

24
So what?

25
“Everybody in” Itasca Project MSPWin Many (more) initiatives are now addressing workforce disparities
 initiatives are now addressing workforce disparities")
29
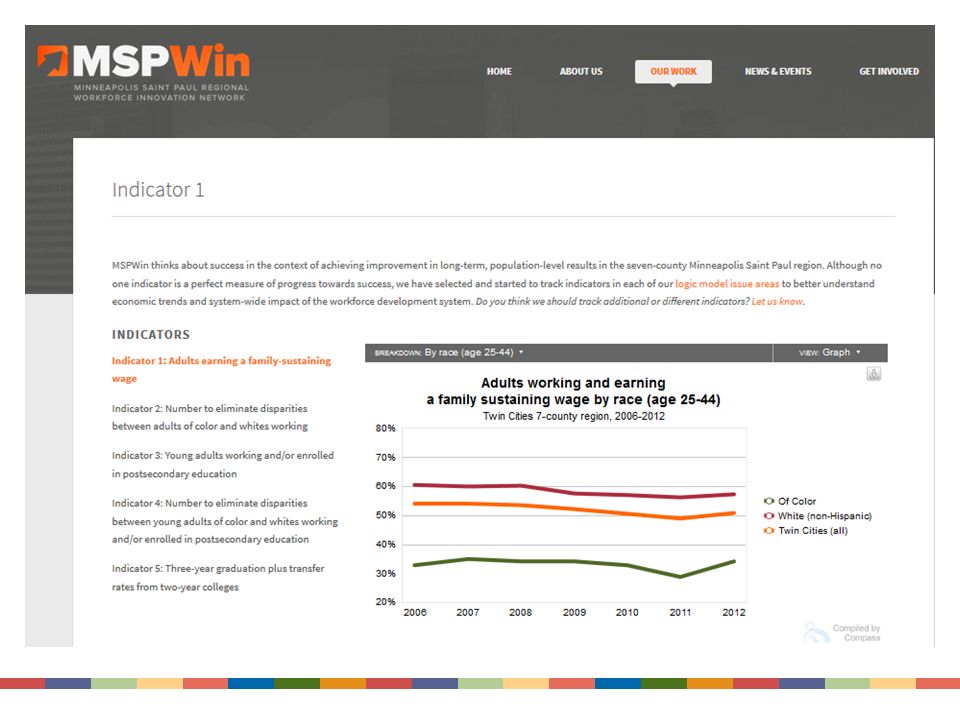
23 points 21 points 11 points Adults (age 25-44) working AND earning a family-sustaining wage Twin Cities 7-county Region, 2012 9 points
 working AND earning a family-sustaining wage Twin Cities 7-county Region, points")
31
Sign up for our e-newsletter at mncompass.org Text MNCOMPASS to 22828 to sign up for our e-newsletter Follow us on Twitter @MNCompass Connect with MN Compass on Facebook Please keep in touch!

Similar presentations


 Demographic Highlights TEXAS is: big. The population.>")


 Age 18-24 Age 25-64 Speak English Poorly or Not at All – Age 18 to 64 (%) High.>")


