Download presentation
Presentation is loading. Please wait.

1
Monitoring Achievement and Progress in Independent Schools Running Your School on Data January 2011 Peter Hendry: CEM Consultant Peter.Hendry@cem.dur.ac.uk

2
Running your school on data CEM data includes: Baseline test acquired ability data (IPRs) ‘Predictive’ data including chances graphs Value-added data Attitudinal data Curriculum assessments (Insight) PARIS software programmes
 ‘Predictive’ data including chances graphs Value-added data Attitudinal data Curriculum assessments (Insight) PARIS software programmes")
3
Teachers to help learners Curriculum and staffing decisions Target setting and monitoring pupil progress Inspection evidence Self-evaluation Monitoring changes over time such as pupil ability intake profiles and VAD Asking the question ‘can we do better?’ i.e. the data is used to aid and to support professional judgement CEM data is used for, e.g.

4
with due consideration to: Ethos and tradition of ‘my’ school Accountability Parental expectations Staff training in use of data and ability to cope with data (data overload) Integrating the data into school procedures, storage, retrieval, distribution and access (..........policy?) i.e. doing our best to help every pupil to at least achieve, if not exceed, their potential

5
So much data................................! 1.Which data do I need AND which data do I not need? 2.What does the data mean and what doesn't the data mean? 3.Who is the data for? Who does not need to have some of the data? Some key questions:

6
1. What data do I need? A key first step! e.g. using MidYIS GCSE predictive data for target setting Based on whole MidYIS cohort? Based on the Independent Sector? Based on the school’s prior value-added? Point and/or grade predictions? (e.g. 6.2/grade B) The chances graphs?
 The chances graphs .")
7
MidYIS baseline score:120 subject predictions: all MidYIS cohort 6.4 6.2 5.7

8
7.1 7.0 6.4 subject predictions: Independent Sector MidYIS baseline score: 104

9
Comparing MidYIS predictions

10
Prediction 6.3 A/B

11
Prediction 6.9 A (Independent Sector)
")
12
Prediction 7.4 A*/A

13
Discussion: setting the targets........... Which type of predictive data would you use to set the targets, and why? Would your students be involved as part of the target setting process? Would parents be informed about the process and outcome? How would you ensure that HoDs were involved to ensure overview the process?

14
2. What does the data mean? e.g. value-added data: The difference between raw and standardised residuals The use of confidence limits to distinguish between average and statistically significant data, and to allow for small entry subjects Can ‘zero’ or negative value-added be acceptable?

15
Raw residual Bar chart (MIDYIS and YELLIS only)
")
16
Standardised Residual Bar Chart 99.7% confidence limit 95% confidence limit ANY VALUE IN THE INNER SHADED AREA IS WITHIN THE EXPECTED RANGE AND IS THEREFORE CONSIDERED TO BE AVERAGE

17
Raw residual Bar chart (MIDYIS and YELLIS only)
")
18
Standardised Residual Bar Chart 99.7% confidence limit 95% confidence limit ANY VALUE IN THE INNER SHADED AREA IS CONSIDERED TO BE AVERAGE VALUE ADDED

19
Standardised Residual Bar Chart

20
3. CEM data: who is it for? For example: SMT/SLT: HoDs: Subject teachers: Form/House Tutors: Head of Learning/Year: Parents: Pupils: Governors:

21
Case study: Alis value-added data Four sets of VAD are available! From average GCSE baseline: all Alis cohort type of Institution (Independent Sector) syllabus From the baseline test all Alis cohort
 syllabus From the baseline test all Alis cohort.")
22
School SPC Chart with confidence limits: Baseline Av. GCSE All Alis Cohort: Institution Syllabus

23
Using PARIS software: CABT Baseline Whole School From your perspective, which set of VAD would you use for the different user groups? (Governors, HoDs, Parents, SMT/SLT...)
.")
24
A key question is therefore....... ‘Is it possible to keep adding value at each key stage?’ Typical Av. GCSE Subject Raw Residuals

25
A2 Intake Profiles: typical average GCSEs for students in each subject Typical Av. GCSE Subject Standardised Residuals

26
2009 A2 2010 A2

27
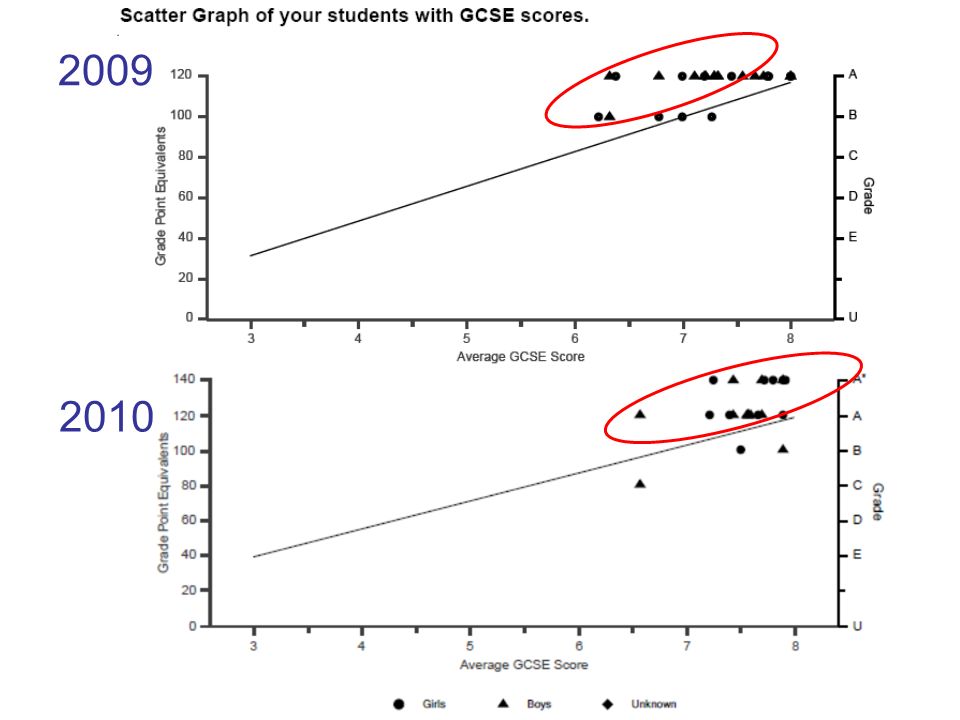
2009 2010
28
USE ONE YEARS DATA WITH CAUTION! Better to use three years data as patterns over time are more significant.

Similar presentations


 & S2 Curriculum-based.>")


